- Courses
- GS Full Course 1 Year
- GS Full Course 2 Year
- GS Full Course 3 Year
- GS Full Course Till Selection
- Essay Target – 150+ Marks
- Online Program
- GS Recorded Course
- NCERT (Recorded 500+ Hours)
- Polity Recorded Course
- Geography Recorded Course
- Economy Recorded Course
- AMAC Recorded Course
- Modern India, Post Independence & World History
- Environment Recoded Course
- Governance Recoded Course
- Science & Tech. Recoded Course
- International Relations and Internal Security Recorded Course
- Disaster Management Module Course
- Ethics Recoded Course
- Current Affairs Recoded Course
- CSAT
- 5 LAYERED ARJUNA Mentorship
- Public Administration Optional
- ABOUT US
- OUR TOPPERS
- TEST SERIES
- FREE STUDY MATERIAL
- VIDEOS
- CONTACT US
Rural and Urban Food Spending Rises Amid Inflation Pressure (HCE Report)
Rural and Urban Food Spending Rises Amid Inflation Pressure (HCE Report)
- The Household Consumption Expenditure Survey (HCES) released by the Ministry of Statistics and Programme Implementation (MoSPI) (National Statistics Office (NSO) for August 2023–July 2024 shows a slight increase in food spending by rural and urban households, driven by food price inflation.
- Experts suggest the increase is small and may be a temporary change, within the margin of error.
Key Findings from the Household Consumption Expenditure Survey (HCES):
|
Category |
Rural Areas (2023-24) |
Urban Areas (2023-24) |
Rural Areas (2022-23) |
Urban Areas (2022-23) |
|
Food Spending (% of MPCE) |
47.04% |
39.7% |
46.4% |
39.2% |
|
Overall MPCE (₹ per capita) |
₹4,122 |
₹6,996 |
₹3,779 |
₹6,456 |
|
Spending on Cereals (% of MPCE) |
4.99% |
3.76% |
4.91% |
3.64% |
|
Cereal Consumption (kg) |
9.35 kg |
8.02 kg |
9.61 kg |
8.05 kg |
|
Egg, Fish & Meat Spending (% of MPCE) |
4.92% |
3.56% |
4.91% |
3.57% |
|
Beverages & Processed Foods Spending (% of MPCE) |
9.84% |
11.09% |
9.62% |
10.64% |
|
Non-food Spending (% of MPCE) |
52.96% |
60.32% |
53.62% |
60.83% |
|
Average Monthly Spending (Top 5%) |
₹10,137 |
₹20,310 |
₹10,501 |
₹20,824 |
|
Average Monthly Spending (Bottom 5%) |
₹1,677 |
₹2,376 |
₹1,373 |
₹2,001 |
|
State with Highest MPCE |
Sikkim |
Sikkim |
Sikkim |
Sikkim |
|
State with Lowest MPCE |
Chhattisgarh |
Chhattisgarh |
Chhattisgarh |
Chhattisgarh |
Key Analysis:
-
Food Spending Increase:
- Rural Areas: The proportion of money spent on food increased to 47.04% of the total consumption expenditure (MPCE), compared to 46.4% last year.
- Urban Areas: The share of spending on food rose to 39.7%, up from 39.2% in the previous year.
-
Overall Expenditure Growth:
- Rural Households: The MPCE (monthly per capita consumption expenditure) in rural areas rose by 9.2%, from ₹3,779 to ₹4,122.
- Urban Households: Urban household spending grew by 8.3%, from ₹6,456 to ₹6,996.
-
Cereal Spending Trends:
- Rural Areas: Spending on cereals increased slightly to 4.99% of the total expenditure (up from 4.91%).
- Urban Areas: The proportion of urban household spending on cereals rose to 3.76%, from 3.64%.
- Despite the increase in spending, cereal consumption has slightly decreased in both rural and urban households:
- Rural: From 9.61 kg to 9.35 kg.
- Urban: From 8.05 kg to 8.02 kg.
-
Increase in Spending on Other Foods:
- Vegetables, fruits, pulses, and meat saw an increase in expenditure, reflecting the high prices of these items.
-
Decline in Non-Food Expenditure:
- Rural Areas: Spending on medical care, education, fuel, rent, and durable goods decreased.
- Urban Areas: Urban households also reduced spending on fuel, medical care, conveyance, pan and tobacco, and durable goods.
-
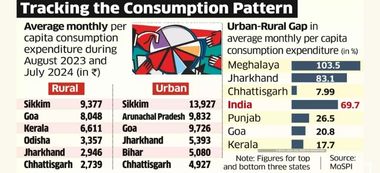
Rural-Urban Gap:
- The difference between rural and urban household spending narrowed slightly. Rural households now spend 69.7% of what urban households spend, down from 71.2% in 2022–23.
State-Level Spending Trends:
- Western and Northern States: Higher-than-national average spending was observed in states like Maharashtra, Punjab, Tamil Nadu, Kerala, and Gujarat.
- Eastern and Central States: States like West Bengal, Bihar, Assam, Odisha, Uttar Pradesh, and Chhattisgarh had lower-than-average spending.
- Rajasthan: Showed contrasting trends with higher rural spending and lower urban spending compared to the national average.
-
State-Level Spending Differences:
- Sikkim had the highest MPCE in both rural (₹9,377) and urban (₹13,927) areas.
- Chhattisgarh had the lowest MPCE: ₹2,739 (rural) and ₹4,927 (urban).
-
Survey Methodology:
- The survey included 261,953 households (154,357 rural and 107,596 urban), using an improved methodology recommended by the National Statistical Commission (NSC).
Expert Opinions
- P.C. Mohanan (Former Acting Chairman, NSC):
- He attributed the rise in food expenditure mainly to food inflation but emphasized that the observed increase is within the margin of error and likely temporary.
- Pronab Sen (Former Chief Statistician of India):
- He noted that the NSO conducted back-to-back surveys with improved methodology, and the results are consistent, indicating that the observed changes are not part of a long-term trend but temporary adjustments due to rising prices.
Final Thoughts:
This data highlights the impact of inflation on household budgets, particularly food. While spending on food is increasing, the overall trend may not be sustained, and it reflects temporary pressures rather than a permanent shift in consumption patterns. The survey provides valuable insights into how households across India are adjusting to rising prices.

|
Also Read |
|

Japan’s New AI Law: Promoting Innovation
Kerala High Court Allows Trans Couple as "Parents" on Birth Certificates

India Opens Doors to Foreign Law Firms
Karol Bagh Metro Pillar No. 112, Above Domino's, 22B, First Floor, New Delhi - 110060
Very Important Instruction For Any Issue, Student Must Produce His/Her Fee Receipt. Without Fee Receipt, It Will Not Be Possible To Track Your Details. If You Have Been Given Any Special Consideration, You Must Keep That In Writing And Produce In Case Of Conflict.
Copyright © 2024-2026 ENSURE IAS. All rights reserved.