- Courses
- GS Full Course 1 Year
- GS Full Course 2 Year
- GS Full Course 3 Year
- GS Full Course Till Selection
- Online Program
- GS Recorded Course
- NCERT (Recorded 500+ Hours)
- Polity Recorded Course
- Geography Recorded Course
- Economy Recorded Course
- AMAC Recorded Course
- Modern India, Post Independence & World History
- Environment Recoded Course
- Governance Recoded Course
- Science & Tech. Recoded Course
- International Relations and Internal Security Recorded Course
- Disaster Management Module Course
- Ethics Recoded Course
- Essay Recoded Course
- Current Affairs Recoded Course
- CSAT
- 5 LAYERED ARJUNA Mentorship
- Public Administration Optional
- ABOUT US
- OUR TOPPERS
- TEST SERIES
- FREE STUDY MATERIAL
- VIDEOS
- CONTACT US
RBI's 'REPORT ON STATE FINANCES'
RBI's 'REPORT ON STATE FINANCES'
Context:
The Reserve Bank of India (RBI) recently released the annual report titled ‘State Finances: A Study of Budget of 2023-24’ with a focus on 'Revenue Dynamics and Fiscal Capacity of Indian States'.
Key Findings of the Report
- Prudent (well-judged/wise) Fiscal Management: States' consolidated gross fiscal deficit to gross domestic product (GFD-GDP) ratio decreased by 1.3% (4.1% in 2020-21 to 2.8% in 2021-22).
- This decline resulted from a moderation (within reasonable limits) in revenue expenditure and an increase in revenue collection.
- Gross fiscal deficit (GFD) is the amount by which a government's total expenditure exceeds its revenue receipts and non-debt capital receipts (receipts that the government receives from the sale of old assets).
- Increased Capital Outlay: Capital outlay (capital expenditure) is projected to rise by 42.6% in 2023-24, reaching 2.9% of GDP. Capital outlay involves spending on asset creation, influencing economic output positively.
- States’ Total Outstanding Liabilities: The debt-to-GDP ratio of states decreased from 31% (March 2021) to 27.5% (March 2023).
- Despite this, outstanding liabilities may remain above 30% of Gross State Domestic Product (GSDP) for many states.
- The debt-to-GDP ratio measures the proportion of a country's national debt to its gross domestic product.
- Gross State Domestic Product (GSDP) is the sum total volume of all finished goods and services produced during a given period of time, usually a year, within the geographical boundaries of the State.
- Support from the Centre, in the form of 50-year interest-free capex loans, aided in reducing states’ interest burden.
- Net Market Borrowings: States' reliance on net market borrowings decreased to 76% in the budgeted gross fiscal deficit (GFD) for 2023-24. This decline is attributed to an increase in states' loans from the Centre.
- Increased Tax Buoyancy: Implementation of goods and services tax (GST) resulted in enhanced tax buoyancy for the states. GST implementation contributed to greater formalization of the economy, expanding the tax base.
- Tax buoyancy is a key indicator used to measure the efficiency of a government's tax system. It is a measure of how responsive a country's tax revenue is to changes in its Gross Domestic Product (GDP).
- Committed Expenditure: It includes interest payments, administrative services, and pension. It is expected to remain at 4.5% of GDP.
|
|
|
|
|
|
|
|
|
|
|
|
|
|
|
|
|
|
|
|
|
|
|
Must Check: Best IAS Coaching In Delhi

Yala Glacier Declared Dead – Climate Change & Himalayan Cryosphere

Perito Moreno Glacier Retreat – A Stable Giant Now in Decline
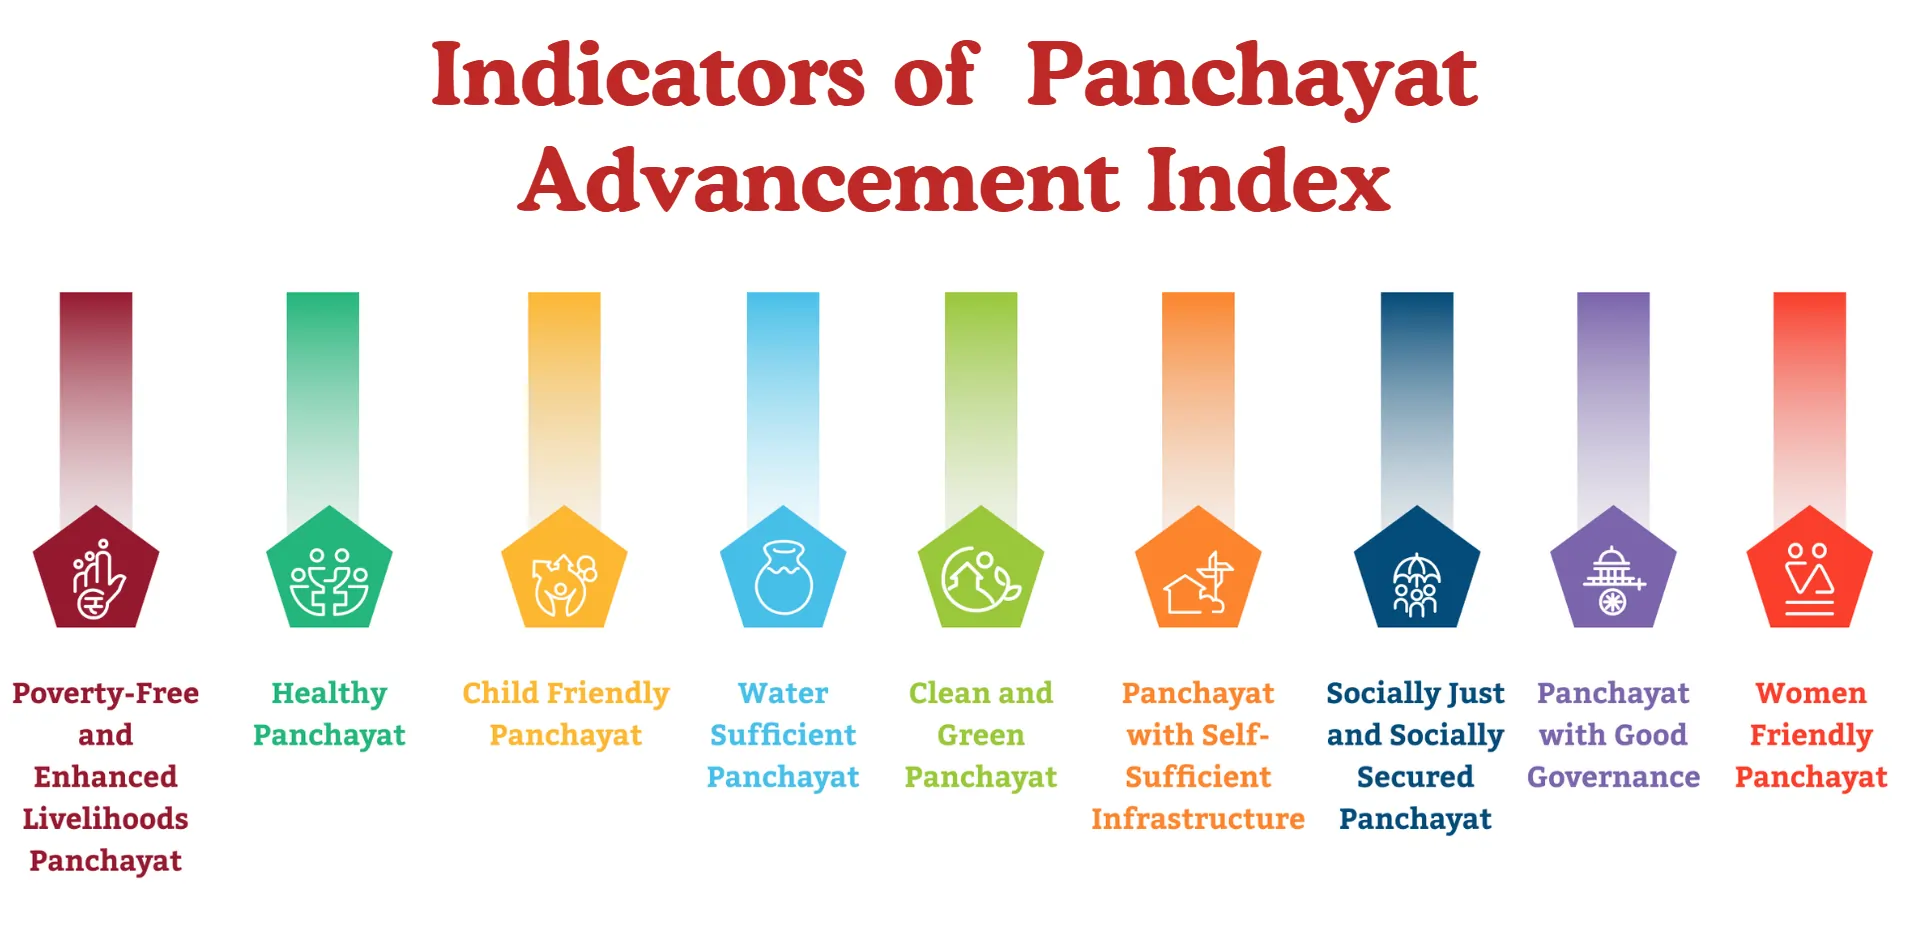
Panchayat Advancement Index (PAI) : Using Local Data for Better Governance
Karol Bagh Metro Pillar No. 112, Above Domino's, 22B, First Floor, New Delhi - 110060
Very Important Instruction For Any Issue, Student Must Produce His/Her Fee Receipt. Without Fee Receipt, It Will Not Be Possible To Track Your Details. If You Have Been Given Any Special Consideration, You Must Keep That In Writing And Produce In Case Of Conflict.
Copyright © 2024-2026 ENSURE IAS. All rights reserved.