- Courses
- GS Full Course 1 Year
- GS Full Course 2 Year
- GS Full Course 3 Year
- GS Full Course Till Selection
- MEP (Mains Enrichment Programme) Data, Facts
- Essay Target – 150+ Marks
- Online Program
- GS Recorded Course
- NCERT- First Ladder
- Polity
- Geography
- Economy
- Ancient, Medieval and Art & Culture AMAC
- Modern India, Post Independence & World History
- Environment
- Governance
- Science & Technology
- International Relations and Internal Security
- Disaster Management
- Ethics
- Current Affairs
- Indian Society and Social Issue
- CSAT
- 5 LAYERED ARJUNA Mentorship
- Public Administration Optional
- ABOUT US
- OUR TOPPERS
- TEST SERIES
- FREE STUDY MATERIAL
- VIDEOS
- CONTACT US
Household Consumption Expenditure Survey (HCES) 2023-24
Household Consumption Expenditure Survey (HCES) 2023-24
30-12-2024
- In December 2024, the Ministry of Statistics & Programme Implementation (MoSPI) has released the findings of the Household Consumption Expenditure Survey (HCES) for 2023-24.
- Conducted by the National Sample Survey Office (NSSO) between August 2023 and July 2024, this survey provides crucial insights into the consumption patterns and expenditure trends of households across India, both rural and urban.
- The findings not only highlight the state of economic well-being but also underline the impacts of social welfare programs, shifts in consumption behaviour, and regional variations.
About Household Consumption Expenditure Survey
- Purpose and Utility: The HCES is designed to collect detailed information on household consumption and expenditure on goods and services. Its key objectives include:
- Assessing trends in economic well-being by measuring poverty, inequality, and social exclusion.
- Updating the basket of goods and services and the weights used for calculating the Consumer Price Index (CPI).
- Generating estimates of Monthly Per Capita Consumption Expenditure (MPCE), a crucial indicator for various analyses.
- Methodology: The 2023-24 survey employed separate questionnaires for food items, consumables and services, and durable goods. This time, multiple visits have been made for data collection to improve accuracy.
- Coverage: Data were collected from around 2,62,000 households across all states and union territories.
- Changes in Methodology: The number of items covered increased from 347 to 405. The survey also introduced separate provisions for recording items received free of cost through social welfare programs.
-
Key Findings
-
Monthly Per Capita Consumption Expenditure (MPCE)
- Rural: From 0.266 (2022-23) to 0.237.
- Urban: From 0.314 (2022-23) to 0.284.
- The reduction in the Gini coefficient highlights decreased consumption inequality across regions.
- The Gini coefficient is a measure of the distribution of income across a population. A higher Gini coefficient indicates greater inequality, with high-income individuals receiving much larger percentages of the population’s total income.
- Inequality Trends: The Gini coefficient, a measure of inequality, declined in both rural and urban areas:
- Rural households now spend approximately 69.7% of what urban households spend.
- Urban-Rural Gap: The urban-rural MPCE gap narrowed to 69.7% in 2023-24 from 71.2% in 2022-23, showcasing sustained rural consumption growth.
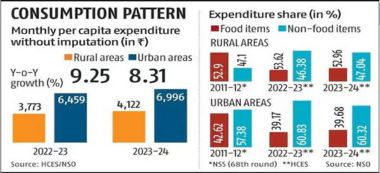
- Rural Areas: The average MPCE stood at around ₹4,120, an increase of 9.3% compared to 2022-23.
- Urban Areas: The average MPCE was around ₹7,000, reflecting an 8.3% growth from the previous year.
- With Imputed Values: When including free items received via social welfare programs, the MPCE rose to around ₹4,250 (rural) and ₹7,080 (urban).
Consumption Patterns
-
Expenditure Distribution
- Non-Food Items: Account for around 53% of household spending in rural areas (up from 47% in 2011-12).
- While in Urban areas, it accounts for around 60% in urban areas (up from 57%).
- Major contributors include conveyance, medical expenses, clothing, bedding, footwear, entertainment, and rent.
- Food Items: The share of food expenditure rose slightly in 2023-24:
- Rural: 47.04% (up from 46.38% in 2022-23).
- Urban: 39.68% (up from 39.17% in 2022-23).
- Beverages, refreshments, and processed food dominate the food basket in both rural and urban areas.
-
State-Wise Patterns
- Highest MPCE: Sikkim (₹9,377 rural; ₹13,927 urban).
- Lowest MPCE: Chhattisgarh (₹2,739 rural; ₹4,927 urban).
- Regional Trends:
- Higher spending states: Maharashtra, Punjab, Tamil Nadu, Telangana, Kerala, Karnataka, Haryana, Gujarat, Andhra Pradesh.
- Lower spending states: West Bengal, Bihar, Assam, Odisha, Uttar Pradesh, Madhya Pradesh, Jharkhand, Chhattisgarh.
- Rajasthan: An exception with higher rural spending but lower urban spending compared to the national average.
Income Distribution and Spending Trends
-
Spending by Income Groups:
- Top 5%: Decline in MPCE for rural (₹10,137) and urban (₹20,310) households compared to 2022-23.
- Bottom 5%: Significant increase in MPCE for rural (₹1,677) and urban (₹2,376) households.
- Bottom 20%: Highest percentage growth in spending: 19.2% (rural) and 18% (urban).
- Top 20%: Marginal growth: 1.5% (rural) and 1.1% (urban).
-
Sectoral Breakdown:
- Food Items:
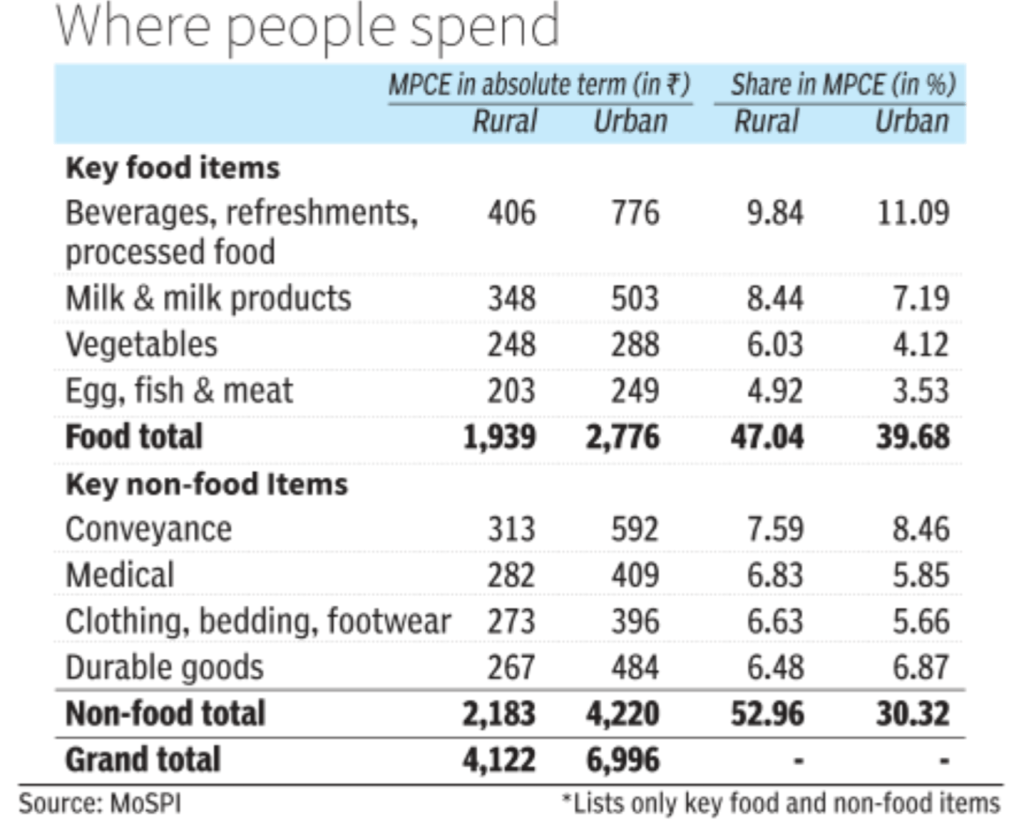
- Cereals: Slight increase in share (4.99% rural; 3.76% urban).
- Beverages and processed foods: Largest share (9.84% rural; 11.09% urban).
- Non-Food Items:
- Rural: 52.96% of expenditure driven by conveyance, medical expenses, and clothing.
- Urban: 60.32%, primarily on rent, entertainment, and durable goods.
Trends and Implications: Positive Trends
- Economic Recovery: Overall household spending rose by 3.5% in real terms from August 2023 to July 2024. The findings reflect the ongoing recovery of the Indian economy.
- Reduction in Inequality: Social welfare programs, such as PM-KISAN and PM Garib Kalyan Anna Yojana, have significantly contributed to narrowing consumption inequality.
- Rise in Non-Food Spending: Increased spending on non-food items signals a shift towards a consumption-led economy and improved living standards, particularly in rural areas.
Challenges
- The disparity in consumption patterns among states indicates the need for targeted regional interventions.
- Lifestyle inflation in urban areas requires monitoring to ensure sustainable growth.
Future Outlook
- The HCES 2023-24 findings underscore the narrowing gap between rural and urban consumption and a decline in inequality. Policymakers can leverage these insights to:
- Design targeted interventions to further reduce inequality.
- Enhance the effectiveness of social welfare programs.
- Support sustainable and inclusive economic growth across all regions.
- With improved methodology and comprehensive data, the HCES remains a critical tool for understanding and addressing the evolving needs of Indian households.

|
Also Read |
|
State of the World Population 2025: The Real Fertility Crisis
Updating Economic Indicators: An Important Exercise!
India's Economic Transformation: Infrastructure, Innovation, and Inclusion
Karol Bagh Metro Pillar No. 112, Above Domino's, 22B, First Floor, New Delhi - 110060
Very Important Instruction For Any Issue, Student Must Produce His/Her Fee Receipt. Without Fee Receipt, It Will Not Be Possible To Track Your Details. If You Have Been Given Any Special Consideration, You Must Keep That In Writing And Produce In Case Of Conflict.
Copyright © 2024-2026 ENSURE IAS. All rights reserved.