- Courses
- GS Full Course 1 Year
- GS Full Course 2 Year
- GS Full Course 3 Year
- GS Full Course Till Selection
- Answer Alpha: Mains 2025 Mentorship
- MEP (Mains Enrichment Programme) Data, Facts
- Essay Target – 150+ Marks
- Online Program
- GS Recorded Course
- Polity
- Geography
- Economy
- Ancient, Medieval and Art & Culture AMAC
- Modern India, Post Independence & World History
- Environment
- Governance
- Science & Technology
- International Relations and Internal Security
- Disaster Management
- Ethics
- NCERT Current Affairs
- Indian Society and Social Issue
- NCERT- Science and Technology
- NCERT - Geography
- NCERT - Ancient History
- NCERT- World History
- NCERT Modern History
- CSAT
- 5 LAYERED ARJUNA Mentorship
- Public Administration Optional
- ABOUT US
- OUR TOPPERS
- TEST SERIES
- FREE STUDY MATERIAL
- VIDEOS
- CONTACT US
Union Budget 2025-26
Union Budget 2025-26
Understanding the Indian Budget
- Defined under Article 112 of the Constitution as the "Annual Financial Statement."
- Note: The term "Budget" is not explicitly mentioned in the Constitution.
- A statement of estimated receipts and expenditure of the Government for a financial year.
- The Department of Economic Affairs (DEA) under the Ministry of Finance is responsible for preparing the Union Budget.
|
History of the Indian Budget |
|
|
Pre-Independence
|
Post-Independence
|
Budget Presentation and Approval Process
- Budget is presented in Parliament.
- General discussion in both Houses (Lok Sabha & Rajya Sabha).
- Standing Committees scrutinize the Demands for Grants of individual ministries.
- Detailed discussion and voting on Demands for Grants in Lok Sabha.
- Passing of Appropriation Bill and Finance Bill to give effect to the Budget proposals.
|
Components of the Budget |
|
|
Revenue Budget Includes
|
Capital Budget Includes
|
|
Two Parts of the Budget |
|
|
Part A – Macroeconomic Aspects
|
Part B – Finance Bill
|
|
Budget Documents
|
||
|
Major Budget Documents |
Fiscal Policy Statements (FRBM Act, 2003) |
Other Explanatory Documents
|
|
|
|
|
Provision |
Key points |
|
Article 112 |
President shall in respect of every financial year cause to be laid before both the Houses of Parliament a statement of the estimated receipts and expenditure of the Government of India for that year, referred to as the “annual financial statement’’. |
|
Article 113 |
No demand for a grant shall be made except on the recommendation of the President. |
|
Article 114 |
No amount can be withdrawn from the Consolidated Fund of India (CFI) without authorization from the Parliament. |
|
Article 266 |
All revenues received by the government shall be credited to the “Consolidated Fund of India”. All other public money, such as provident fund, Postal insurance, etc, shall be credited to the Public Account of India. |
|
Article 267 |
Parliament may by law establish a Contingency Fund of India to meet unexpected or unforeseen expenditures. |
- On 1 February 2025, Union Minister for Finance and Corporate Affairs Smt Nirmala Sitharaman presented her 8th consecutive Union Budget 2025-26 in Parliament.
- Theme: "Sabka Vikas" – Balanced growth for all regions
Principles of Viksit Bharat
The budget outlines the following broad principles to achieve a prosperous India: Zero-poverty, 100% good quality school education, Access to high-quality, affordable, and comprehensive healthcare, 100% skilled labour with meaningful employment, 70% women in economic activities, Farmers making our country the ‘food basket of the world’
The budget focuses on 5 key objectives:
- Accelerate growth
- Secure inclusive development
- Invigorate private sector investments
- Uplift household sentiments
- Enhance spending power of India’s rising middle class
Focus Areas: Poor (Garib), Youth, Farmer (Annadata) and Women (Nari)
Transformative Reforms
The budget aims to initiate reforms in the following sectors to augment India’s growth potential and global competitiveness: Taxation, Power Sector, Urban Development, Mining, Financial Sector, and Regulatory Reforms
Four Growth Engines
Finance Minister Nirmala Sitharaman in her budget speech outlined four main engines for India's growth and development
- Agriculture as the First Engine
With initiatives like the PM Dhan-Dhaanya Krishi Yojana, a renewed push for Aatmanirbharta in pulses, and focused support for high-yield seeds, cotton, fruits, vegetables, fisheries, and makhana in Bihar, the budget treats agriculture not just as a welfare sector but a modern growth engine aimed at productivity, sustainability, and rural prosperity. - MSMEs as the Second Engine
The budget strengthens India’s entrepreneurial backbone by easing credit access, revising MSME classification, introducing credit cards for micro enterprises, and boosting labour-intensive sectors like leather, footwear, toys, and food processing. The National Manufacturing Mission and clean-tech focus signal a move toward resilience and scale. - Investment as the Third Engine
It includes public investment in infrastructure, rural skilling, education, AI, health, tourism, and digital connectivity. Simultaneously, private sector-driven R&D is being incentivized, alongside large-scale funding mechanisms like SWAMIH Fund 2 and deep-tech support to catalyze innovation and job creation. - Exports as the Fourth Engine
A new Export Promotion Mission, digital infrastructure like BharatTradeNet, incentives for Global Capability Centres (GCCs), support for air cargo and marine exports, and trade facilitation measures position India as a reliable player in global supply chains.
Budget Estimates 2025-26
|
Metric |
Estimate |
|
Total Receipts (excl. borrowings) |
₹ 34.96 lakh crore |
|
Total Expenditure |
₹ 50.65 lakh crore |
|
Net Tax Receipts |
₹ 28.37 lakh crore |
|
Fiscal Deficit |
4.4% of GDP |
|
Gross Market Borrowings |
₹ 14.82 lakh crore |
|
Capex Expenditure |
₹ 11.21 lakh crore (3.1% of GDP) |
Key Figures from Budget Estimates (BE) 2025-26
- Total Expenditure (BE 2025-26): ₹50,65,345 crore
- Capital Expenditure (BE 2025-26): ₹11,21,090 crore
- Effective Capital Expenditure: ₹15,48,282 crore
- This includes capital expenditure + grants-in-aid for creation of capital assets)
Resource Transfers to States (BE 2025-26)
Resource Transfers to States and Union Territories (BE 2025–26)
- Total Transfers (BE 2025–26): ₹25,01,284 crore
- This includes:
- Devolution of States’ Share in Central Taxes
- Grants and Loans (such as Finance Commission Grants, special assistance, etc.)
- Releases under Centrally Sponsored Schemes (CSS)
- Increase Over Previous Year (2023–24 Actuals): The transfers in 2025–26 are ₹4,91,668 crore higher than the actual transfers made in 2023–24.
BUDGET IN DETAIL
RECEIPTS
- Revenue Receipts
- Revenue receipts are the government’s income from tax and non-tax sources.
- Grown from ₹27.29 lakh crore (2023–24) to ₹34.20 lakh crore (2025–26 BE) — an increase of 25.4% over two years.
- Reflects improved tax buoyancy and better revenue administration.
- Tax Revenue (Net to Centre)
- This is the Centre’s share after devolution to states.
- Increased from ₹23.27 lakh crore to ₹28.37 lakh crore between 2023–24 and 2025–26 — a 22% rise.
- Indicates stable tax collections and increased economic activity.
- Non-Tax Revenue
- Includes dividends, spectrum fees, interest receipts, etc.
- Jumped from ₹4.01 lakh crore to ₹5.83 lakh crore — a sharp 45% growth.
- Suggests dependence on one-time income sources like spectrum auctions and improved PSU performance.
- Capital Receipts (Excluding Borrowings)
- Comprise loan recoveries and disinvestment, excluding borrowings.
- Slight dip from ₹17.14 lakh crore (2023–24) to ₹16.44 lakh crore (2025–26) — a reduction of 4%.
- Indicates a limited push in asset sales or loan recovery during this period.
- Recovery of Loans
- A marginal revenue source — increased from ₹26,646 crore to ₹29,000 crore (up 8.8%).
- Shows minimal fiscal reliance on this stream.
- Other Receipts (e.g., Disinvestment)
- Fluctuating performance — ₹33,122 crore in 2023–24 to a target of ₹47,000 crore in 2025–26.
- Despite 42% increase in BE, past trends show shortfalls, suggesting challenges in executing disinvestment targets.
- Borrowings and Other Liabilities (Fiscal Deficit)
- Represents the government’s borrowing need due to the gap between income and expenditure.
- Reduced from ₹16.54 lakh crore to ₹15.68 lakh crore, showing a decline of 5.2%.
- As % of GDP: From 5.6% (2023–24) to 4.4% (2025–26) — reflecting fiscal consolidation efforts.
- Total Receipts (Revenue + Capital)
- Increased from ₹44.43 lakh crore (2023–24) to ₹50.65 lakh crore (2025–26) — a 14% rise.
- Signifies moderate overall resource expansion, driven largely by revenue gains.
EXPENDITURE
- Total Expenditure
- Mirrors total receipts: ₹44.43 lakh crore (2023–24) to ₹50.65 lakh crore (2025–26).
- Reflects a balanced budget approach in accounting terms.
- Revenue Expenditure
- Day-to-day government spending (salaries, pensions, subsidies).
- Increased from ₹34.94 lakh crore to ₹39.44 lakh crore — a 12.8% rise.
- Share in total expenditure has reduced, indicating shifting focus to capital spending.
- Interest Payments
- Increased from ₹10.64 lakh crore to ₹12.76 lakh crore — a 19.9% rise.
- Comprises ~32% of revenue expenditure in 2025–26 — highlights the burden of past borrowings.
- Grants for Creation of Capital Assets
- Revenue spending that helps create assets, such as state infrastructure grants.
- From ₹3.03 lakh crore to ₹4.27 lakh crore — a 40.6% jump.
- Indicates greater use of revenue funds for productive purposes.
- Capital Expenditure
- Direct asset-creating expenditure (roads, railways, schools).
- Increased from ₹9.49 lakh crore to ₹11.21 lakh crore — 18% growth.
- Central to government’s growth-led economic strategy.
- Effective Capital Expenditure (CapEx + Capex Grants)
- From ₹12.53 lakh crore to ₹15.48 lakh crore — a robust 23.5% rise.
- Reflects a high-quality fiscal push toward long-term asset creation.
DEFICITS
- Revenue Deficit (Revenue Expenditure – Revenue Receipts)
- Revenue Deficit = Revenue Expenditure – Revenue Receipts
- Indicates how much the government is borrowing just to meet its daily operational expenses (salaries, subsidies, pensions).
- The Revenue Deficit has been on a declining trend, reducing from 2.6% of GDP in 2023–24 to 1.9% in the Revised Estimates for 2024–25, and is further projected to fall to 1.5% in the Budget Estimates for 2025–26.
- A lower revenue deficit means more fiscal space for capital investment.
- A high revenue deficit is unsustainable as it shows the government is borrowing for routine expenditure.
- The deficit is declining steadily, showing a better balance in revenue management
- Dropped from ₹7.65 lakh crore (2.6% of GDP) to ₹5.23 lakh crore (1.5% of GDP) — a 31.6% reduction.
- Indicates improved matching of day-to-day revenue with earnings.
- Effective Revenue Deficit (Revenue Deficit – Capex Grants)
- Effective Revenue Deficit = Revenue Deficit – Grants for creation of capital assets
- This adjusts for revenue expenses that lead to asset creation (like grants to states for capital work).
- A better measure than revenue deficit to know how much non-productive revenue expenditure is happening.
- A low or zero effective revenue deficit means borrowed money is being used productively.
- The Effective Revenue Deficit has shown a sharp decline, falling from 1.6% of GDP in 2023–24 to 1.0% in the Revised Estimates for 2024–25, and is projected to further reduce to just 0.3% in the Budget Estimates for 2025–26.Sharp decline indicates the government is directing revenue funds toward capital creation.
- From ₹4.61 lakh crore to ₹96,654 crore — a massive 79% drop.
- Now just 0.3% of GDP, showing most revenue deficit is now productive spending.
- Fiscal Deficit
- It reflects the total borrowing requirement of the government.
- A high fiscal deficit means the government is spending much more than it earns, leading to more borrowing.
- The Fiscal Deficit is steadily narrowing, declining from 5.6% of GDP in 2023–24 to 4.8% in the Revised Estimates for 2024–25, and is further targeted to reduce to 4.4% in the Budget Estimates for 2025–26.
- It's closely watched by credit rating agencies and investors for economic stability.
- Trend is downward, showing the government’s commitment to fiscal consolidation and reducing dependence on borrowings.
- Primary Deficit (Fiscal Deficit – Interest Payments)
- Primary Deficit = Fiscal Deficit – Interest Payments
- It shows the government's current year shortfall, excluding past interest burdens.
- It tells us if the government is borrowing just to pay interest or also to meet new spending.
- A low primary deficit means fiscal stress is under control, excluding debt repayment.
- The Primary Deficit, which excludes interest payments from the fiscal deficit, is on a consistent downward path — declining from 2.0% of GDP in 2023–24 to 1.3% in the Revised Estimates for 2024–25, and further to 0.8% in the Budget Estimates for 2025–26.
Steady decline shows greater fiscal discipline and reduced fresh borrowing pressure. - Reduced sharply from ₹5.91 lakh crore to ₹2.93 lakh crore — a 50% fall.
- Indicates that apart from interest costs, the government is close to balancing its core budget.
Sources of Receipts – Union Budget 2025–26
(Breakdown per ₹1 received by the Government)
- Income Tax – ₹0.22 (22%)
- Represents the personal income tax collected from individuals and Hindu Undivided Families (HUFs).
- It is the largest single contributor to the Union Government's receipts, highlighting the growing role of the salaried and small business class.
- Reflects an expanding tax base, increased formalization, and improvements in digital tax compliance systems.
- Corporation Tax – ₹0.17 (17%)
- Levied on the profits of companies and includes both domestic and foreign firms operating in India.
- Indicates strong corporate earnings post-COVID and signals economic revival in the formal business sector.
- The second-largest contributor, this tax is crucial for maintaining the fiscal health of the Centre.
- Goods & Services Tax (GST) & Other Indirect Taxes – ₹0.18 (18%)
- Includes Central GST, service tax remnants, and other indirect taxes like cesses and surcharges.
- Reflects consumption-based taxation, aligning government revenue with overall economic activity.
- A stable and integrated indirect tax regime supports ease of doing business and revenue predictability.
- Union Excise Duties – ₹0.05 (5%)
- Imposed on the manufacture of specific goods, notably petroleum products and tobacco, which lie outside GST.
- The share is declining over time due to the shift of most goods to the GST regime.
- Still remains important due to its role in fuel pricing and revenue from sin goods.
- Customs Duties – ₹0.04 (4%)
- Collected on imports into India, including tariffs on foreign goods.
- Indicates low reliance on trade taxation, aligned with India’s liberal trade policy and global integration.
- Reduced protectionism supports competitiveness but limits revenue potential.
- Non-Tax Revenue – ₹0.09 (9%)
- Comprises dividends from PSUs, interest from loans, spectrum fees, and license charges.
- This is a crucial non-debt, non-tax source that helps reduce fiscal deficit without imposing new taxes.
- Reflects government efficiency in asset utilization and public sector profitability.
- Non-Debt Capital Receipts – ₹0.01 (1%)
- Includes proceeds from disinvestment and recoveries of past loans.
- The small share indicates slow pace of privatization and limited capital recycling.
- Scope exists to improve this through more strategic asset monetization.
- Borrowings & Other Liabilities – ₹0.24 (24%)
- This is the gap between total government expenditure and income, financed through borrowings.
- At nearly one-fourth of every rupee, it shows continued reliance on fiscal deficit financing.
- Highlights the need for prudent fiscal management and deeper revenue mobilization.
- While 76% of receipts are from taxes and income, 24% still comes from borrowings, underlining the importance of fiscal consolidation and sustainable financing.
- Nearly one-fourth of every rupee spent is borrowed, indicating the importance of fiscal discipline and the need to increase revenue efficiency.
Expenditure – Where Does Every ₹1 Go?
(Breakdown per ₹1 spent by the Government)
- State Share of Taxes & Duties – ₹0.22 (22%)
- Devolved to states as per the Finance Commission’s recommendations.
- Reflects the constitutional commitment to fiscal federalism, ensuring state governments have funds to deliver public services.
- This is the largest expenditure item, reaffirming cooperative governance.
- Interest Payments – ₹0.20 (20%)
- Paid on past loans taken by the government, both domestic and external.
- This is a non-productive but unavoidable commitment, consuming 1/5th of the budget.
- It reflects the burden of past deficits and limits spending flexibility for development and welfare.
- Central Sector Schemes – ₹0.16 (16%)
- Fully funded and implemented by the Union Government (e.g., PM Awas Yojana, Jal Jeevan Mission).
- Reflects direct government investment in national-level development, infrastructure, and social welfare.
- Shows strong policy focus on centrally controlled growth programs.
- Centrally Sponsored Schemes – ₹0.08 (8%)
- Jointly funded by Centre and States (e.g., MGNREGA, PM Poshan, National Health Mission).
- Crucial for grassroots development, especially in rural and backward areas.
- Promotes Centre-State collaboration in addressing poverty and social development.
- Defence – ₹0.08 (8%)
- Covers salaries, pensions, procurement, and operations of the Army, Navy, and Air Force.
- Essential for national security and strategic preparedness.
- Allocation is stable, balancing military needs with fiscal limits.
- Finance Commission & Other Transfers – ₹0.08 (8%)
- Includes grants to states for local bodies, disaster relief, and sectoral development as per the Finance Commission's mandate.
- Enhances state capacity for health, education, infrastructure, and disaster management.
- Supports equalization and fiscal balance across regions.
- Other Expenditure – ₹0.08 (8%)
- Administrative functions, innovation, digital infrastructure, and support to various ministries.
- Reflects spending on governance, regulatory institutions, and emerging sectors like AI, climate tech, and skilling.
- Major Subsidies – ₹0.06 (6%)
- Includes food, fertilizer, and petroleum subsidies.
- Aims to protect vulnerable sections (farmers, poor households) from price volatility.
- Share has reduced over time, showing an attempt to target and rationalize subsidies.
- Pensions – ₹0.04 (4%)
- For retired civil and defence personnel, under the old pension scheme.
- Represents a legacy liability, especially with increasing life expectancy.
- Calls for long-term pension reforms and sustainability of retirement systems.
- 42% of total expenditure is locked in committed liabilities — 22% to states and 20% to interest payments.
- This leaves only ~30–35% of the budget for developmental and welfare spending, emphasizing the need for fiscal prioritization and reforms
Sources of Deficit Financing
To meet its fiscal deficit, the government relies on a mix of financing tools in addition to market borrowings (G-secs). The key alternative sources are as follows:
1. Securities Against Small Savings
- This includes borrowings from small savings schemes such as the Public Provident Fund (PPF), National Savings Certificates (NSC), Sukanya Samriddhi Yojana, and others. These instruments are popular among households and offer the government a non-market source of funds.
- The reliance on small savings was ₹5.5 lakh crore in 2021–22, but it has steadily decreased to ₹4.0 lakh crore in 2022–23 and ₹4.5 lakh crore in 2023–24.
- In the Revised Estimates of 2024–25, this dropped further to ₹4.1 lakh crore, and for 2025–26 (BE), it is projected to be ₹3.4 lakh crore.
- This trend suggests that while small savings remain a key source, the government is gradually reducing its dependence, possibly due to liquidity constraints and the relatively higher cost of funds associated with these instruments.
- Small savings remain the top non-market source, though they're slowly declining.
2. Short-Term Borrowings (Treasury Bills and Similar Instruments)
- Short-term borrowings are typically of less than one year duration, used to manage temporary mismatches in cash flows.
- The amount raised through short-term borrowings stood at ₹0.8 lakh crore in 2021–22, which rose slightly to ₹1.1 lakh crore in 2022–23.
- However, it sharply declined to ₹0.5 lakh crore in 2023–24, and in 2024–25 (RE), the government is actually planning a net repayment of ₹1.2 lakh crore — indicating it is paying back more than it borrows.
- For 2025–26 (BE), the figure is ₹0, implying no new short-term borrowing is planned.
- This marks a clear shift toward long-term and more stable financing methods, reducing dependency on quick but volatile funding sources.
- Short-term borrowings are being reduced or repaid—a sign of long-term debt discipline.
3. Other Sources (Public Account, State Provident Funds, External Debt, etc.)
- This includes borrowing from internal debt mechanisms like the Public Account, state provident funds, and external multilateral/bilateral lenders.
- In 2021–22, this category contributed ₹2.2 lakh crore, which fell to ₹1.2 lakh crore in 2022–23, and further declined to ₹0.7 lakh crore in 2023–24.
- For 2024–25 (RE), the inflow is estimated at ₹1.1 lakh crore, while for 2025–26 (BE), it returns to ₹0.7 lakh crore.
- The steady decline in this source shows a move towards more disciplined and predictable debt management, with less reliance on miscellaneous or ad hoc funding mechanisms.
4. Market Borrowings – The Core Source
- Despite diversification, market borrowings via long-term government securities (G-Secs) remain the primary and most stable source of financing.
- Across recent years, these borrowings have been stable in the range of ₹11.5–₹12.3 lakh crore annually.
- The government continues to rely on this channel as its mainstay for financing fiscal deficit, though it ensures borrowing stays within a controlled and sustainable range to maintain macroeconomic stability and investor confidence.
Trend in Gross Tax Receipts (as % of GDP)
- Gross Tax Receipts refer to the total tax revenue collected by the government before deducting the share of taxes that must be transferred to the states as per Finance Commission recommendations.
- Net Tax Receipts (also called Net Tax Revenue to Centre) refer to the Central Government’s actual share of tax revenue after deducting the states’ share of taxes as mandated by the Finance Commission.
- Overall Gross Tax Receipts
- From 2016–17 to 2018–19, gross tax revenue remained relatively stable, hovering around 11.0% to 11.2% of GDP.
- However, in 2019–20 and 2020–21, the ratio declined to 10.0% and 10.2% respectively. This fall can be attributed to the combined effects of an economic slowdown and the COVID-19 pandemic, which severely impacted income, consumption, and business activity.
- Post-pandemic, there has been a strong and sustained recovery. From 2021–22 onwards, tax receipts have been rising steadily, with gross tax revenue projected to reach 12.0% of GDP in BE 2025–26 — the highest in the past decade.
- This rebound reflects a strengthening tax base, better enforcement, and revival in both consumption and income growth.
- Direct Tax Collection Trends (as % of GDP)
- Direct taxes (including personal income tax and corporation tax) saw a gradual increase from 5.5% of GDP in 2016–17 to 6.0% in 2018–19, reflecting rising income levels and formalization.
- The pandemic years saw a setback, with a decline to 5.2% in 2019–20 and further to 4.8% in 2020–21.
- However, from 2021–22 onwards, there has been a strong and consistent rise in direct tax collections, with BE 2025–26 projecting them at 7.1% of GDP — a significant improvement and the highest in recent years.
- This trend suggests higher corporate profitability, better tax compliance, and expanding formal sector employment. It also indicates a welcome shift toward more progressive taxation.
- Indirect Tax Collection Trends (as % of GDP)
- Indirect tax collections, which include GST, excise, and customs duties, saw a gradual decline from 5.6% in 2016–17 to 5.0% in 2018–19, reflecting the transition to GST and rate rationalization.
- In 2020–21, there was a slight uptick to 5.4%, possibly due to higher excise collections on fuel and improved compliance.
- Since 2021–22, indirect tax revenue has largely stabilized between 5.0% and 5.5%, although there has been a mild dip to 4.9% in recent years.
- The plateau suggests that while GST is now well-established, growth in indirect taxes is slower, potentially due to moderate consumption growth and tax rate reductions on essential items.
Union Budget 2025–26 – Key Expenditure
1. Total Government Expenditure Growth
- The government's total expenditure has grown from ₹19.75 lakh crore in 2016–17 to ₹50.65 lakh crore in 2025–26 (BE) — over 2.5x increase in a decade.
- This reflects sustained investment in welfare, infrastructure, and development, while also accommodating rising liabilities.
2. Rising Interest Payments – A Fiscal Constraint
- Interest payments are projected at ₹12.76 lakh crore in 2025–26, up from ₹10.64 lakh crore in 2023–24 — nearly 20% growth.
- They form over 25% of total expenditure, showing the significant burden of past borrowings on the fiscal space.
3. Capital Expenditure Push – Infrastructure-Led Growth
- Capital expenditure (asset creation) will rise from ₹9.49 lakh crore (2023–24) to ₹11.21 lakh crore (2025–26), an increase of 18%.
- Grants-in-aid for capital assets — mostly to states/PSUs — also grow sharply by 41%, reaching ₹4.27 lakh crore.
- Total effective capital expenditure will reach ₹15.48 lakh crore in 2025–26, forming about 4.3% of GDP.
- This indicates a strong structural shift toward productive, growth-oriented public spending.
4. Capital vs Revenue Spending – Improving Quality of Expenditure
- Capital expenditure’s share in GDP has almost doubled from 2.6% (2018–19) to 4.3% (2025–26 BE).
- Revenue expenditure (non-asset creating, like salaries and pensions) is expected to decline as a share of GDP — from 14.4% (2020–21) to 9.8% (2025–26).
- This reflects a more disciplined and investment-focused budget framework.
5. Major Sectoral Allocations in 2025–26
- Interest Payments: ₹12.76 lakh crore (25.2% of total expenditure)
- Transport: ₹5.49 lakh crore — strong focus on roads, railways, infrastructure
- Defence: ₹4.92 lakh crore — steady allocation for security and procurement
- Rural Development: ₹2.67 lakh crore
- Pensions: ₹2.77 lakh crore
- Total Subsidies: Over ₹3.8 lakh crore (food, fertiliser, petroleum)
6. Social Sector Priorities
- Health: ₹98,311 crore
- Education: ₹1.28 lakh crore
- Urban Development: ₹96,777 crore (a sharp increase from ₹63,670 crore)
- Agriculture & Allied Sectors: ₹1.71 lakh crore (from ₹1.41 lakh crore in 2024–25)
- Science & Tech saw a massive 68% increase — reflecting push in innovation and R&D.
7. Transfers to States – Stronger Fiscal Federalism
- Transfers to States/UTs increase from ₹20.65 lakh crore (2023–24) to ₹25.60 lakh crore (2025–26) — a growth of ~24%.
- Devolution of taxes alone accounts for ₹14.22 lakh crore (56% of total transfers).
- Other transfers include Centrally Sponsored Schemes (₹5.14 lakh crore), Finance Commission Grants (₹1.33 lakh crore), and capital loans/grants like the ₹1.5 lakh crore Special Capex Assistance.
8. Composition of Expenditure – Long-Term Strategy
- Central Sector Schemes (e.g., PM Awas, Jal Jeevan) consistently take up ~30–32% of spending.
- Interest payments and establishment costs together account for another ~35%.
- Centrally Sponsored Schemes and Finance Commission grants reflect growing Centre-State collaboration.
- Effective Capital Expenditure is increasing — over ₹15 lakh crore in 2025–26 — indicating long-term multiplier benefits.
While total spending is rising, the focus is clearly shifting from revenue-heavy to capital-intensive expenditure.This aligns with goals of job creation, infrastructure development, and sustainable growth, while controlling revenue leakages.
ENGINES OF GROWTH
The budget highlights the following sectors as engines of growth in the journey to Viksit Bharat:

|
AGRICULTURE AS THE 1st ENGINE OF DEVELOPMENT |
|
|
Initiative |
Key Points |
|
Prime Minister Dhan-Dhaanya Krishi Yojana |
- Developing Agri Districts Programme, Covering 100 districts with low productivity, moderate crop intensity, and below-average credit parameters, Benefiting 1.7 crore farmers - Launched in partnership with the states |
|
Building Rural Prosperity and Resilience |
- Comprehensive multi-sectoral programme, Phase-1 covering 100 developing agri-districts - Focus on addressing under-employment in agriculture through skilling, investment, technology, and invigorating the rural economy, Launched in partnership with states |
|
Aatmanirbharta in Pulses |
- 6-year mission, Focus on Tur, Urad, and Masoor - NAFED and NCCF to procure these pulses from farmers during the next 4 years |
|
Comprehensive Programme for Vegetables & Fruits |
- Promote production, efficient supplies, processing, and remunerative prices for farmers - Launched in partnership with states |
|
Makhana Board in Bihar |
- Improve production, processing, value addition, and marketing of makhana |
|
National Mission on High Yielding Seeds |
- Strengthen the research ecosystem, Targeted development and propagation of seeds with high yield, Commercial availability of more than 100 seed varieties |
|
Fisheries |
- Framework for sustainable harnessing of fisheries from Indian Exclusive Economic Zone and High Seas, Special focus on the Andaman & Nicobar and Lakshadweep Islands |
|
Mission for Cotton Productivity |
- 5-year mission, Facilitate significant improvements in productivity and sustainability of cotton farming, Promote extra-long staple cotton varieties |
|
Enhanced Credit through KCC |
- Loan limit under the Modified Interest Subvention Scheme enhanced from ₹ 3 lakh to ₹ 5 lakh for loans taken through the KCC |
|
Urea Plant in Assam |
- Annual capacity of 12.7 lakh metric tons, Located at Namrup, Assam |
|
MSMEs AS THE 2nd ENGINE OF DEVELOPMENT |
|
|
Initiative |
Key Points |
|
Revision in Classification Criteria |
- Investment limit enhanced to 2.5 times,Turnover limit enhanced to 2 times, Applies to all MSMEs
|
|
Credit Cards for Micro Enterprises |
- Customized Credit Cards with ₹ 5 lakh limit for micro enterprises registered on Udyam portal - 10 lakh cards to be issued in the first year |
|
Fund of Funds for Startups |
- New Fund of Funds with a fresh contribution of ₹ 10,000 crore, Expanded scope |
|
Scheme for First-time Entrepreneurs |
- New scheme for 5 lakh women, Scheduled Castes, and Scheduled Tribes first-time entrepreneurs - Provide term-loans up to ₹ 2 crore in the next 5 years |
|
Focus Product Scheme for Footwear & Leather Sectors |
- Enhance productivity, quality, and competitiveness of India’s footwear and leather sector - Facilitate employment for 22 lakh persons, Generate turnover of ₹ 4 lakh crore, Exports of over ₹ 1.1 lakh crore |
|
Measures for the Toy Sector |
- Scheme to create high-quality, unique, innovative, and sustainable toys, Making India a global hub for toys |
|
Support for Food Processing |
- National Institute of Food Technology, Entrepreneurship and Management to be set up in Bihar |
|
Manufacturing Mission |
- National Manufacturing Mission covering small, medium, and large industries - Furthering the “Make in India” initiative |
INVESTMENT AS THE 3rd ENGINE OF DEVELOPMENT |
|
|
Investing in People |
|
|
Initiative |
Key Points |
|
Saksham Anganwadi and Poshan 2.0 |
- Enhanced cost norms for nutritional support |
|
Atal Tinkering Labs |
- 50,000 Atal Tinkering Labs to be set up in Government schools in the next 5 years |
|
Broadband Connectivity |
- Broadband connectivity to all Government secondary schools and primary health centres in rural areas under the Bharatnet project |
|
Bharatiya Bhasha Pustak Scheme |
- Provide digital-form Indian language books for school and higher education |
|
National Centres of Excellence for Skilling |
- 5 National Centres of Excellence for skilling with global expertise and partnerships - Equip youth with skills for “Make for India, Make for the World” manufacturing |
|
Expansion of Capacity in IITs |
- Additional infrastructure in 5 IITs started after 2014, Facilitate education for 6,500 more students |
|
Centre of Excellence in AI for Education |
- Total outlay of ₹ 500 crore |
|
Expansion of medical education |
- 10,000 additional seats in medical colleges and hospitals next year - Adding to 75,000 seats in the next 5 years |
|
Day Care Cancer Centres |
- Set up in all district hospitals in the next 3 years, 200 Centres in 2025-26 |
|
Strengthening urban livelihoods |
- Scheme for socio-economic upliftment of urban workers - Help improve incomes and sustainable livelihoods |
|
PM SVANidhi |
- Revamped scheme with enhanced loans from banks, UPI-linked credit cards with ₹ 30,000 limit |
|
Social Security Scheme for Online Platform Workers |
- Identity cards, registration on e-Shram portal, Healthcare under PM Jan Arogya Yojna for gig workers |
|
Investing in the Economy |
|
|
Initiative |
Key Points |
|
Public Private Partnership in Infrastructure |
- Infrastructure-related ministries to come up with a 3-year pipeline of projects in PPP mode, States also encouraged |
|
Support to States for Infrastructure |
- Outlay of ₹ 1.5 lakh crore for 50-year interest-free loans to states for capital expenditure and incentives for reforms
|
|
Asset Monetization Plan 2025-30 |
- 2nd Plan for 2025-30 to plough back capital of ₹ 10 lakh crore in new projects |
|
Jal Jeevan Mission |
- Extended until 2028 with an enhanced total outlay |
|
Urban Challenge Fund |
- ₹ 1 lakh crore fund for ‘Cities as Growth Hubs’, ‘Creative Redevelopment of Cities’, and ‘Water and Sanitation’, Allocation of ₹ 10,000 crore for 2025-26 |
|
Nuclear Energy Mission for Viksit Bharat |
- Amendments to the Atomic Energy Act and the Civil Liability for Nuclear Damage Act - Research & development of Small Modular Reactors (SMRs) with an outlay of ₹ 20,000 crore, 5 indigenously developed SMRs to be operational by 2033.
|
|
Shipbuilding |
- Revamped Shipbuilding Financial Assistance Policy, Large ships above a specified size to be included in the infrastructure harmonized master list (HML) |
|
Maritime Development Fund |
- Corpus of ₹ 25,000 crore, Up to 49% contribution by the Government, Balance from ports and private sector |
|
UDAN - Regional Connectivity Scheme |
- Modified scheme to enhance regional connectivity to 120 new destinations - Carry 4 crore passengers in the next 10 years, Support helipads and smaller airports in hilly, aspirational, and North East region districts |
|
Greenfield Airport in Bihar |
- Greenfield airports in Bihar, Expansion of Patna airport capacity - Brownfield airport at Bihta |
|
Western Koshi Canal Project in Mithilanchal |
- Financial support for the Western Koshi Canal ERM Project in Bihar |
|
Mining Sector Reforms |
- Policy for recovery of critical minerals from tailings |
|
SWAMIH Fund 2 |
- ₹ 15,000 crore fund for expeditious completion of another 1 lakh dwelling units - Contribution from the Government, banks, and private investors |
|
Tourism for employment-led growth |
- Top 50 tourist destination sites to be developed in partnership with states through a challenge mode |
|
Investing in Innovation |
|
|
Initiative |
Key Points |
|
Research, Development and Innovation |
- ₹ 20,000 crore allocated to implement private sector-driven Research, Development and Innovation initiative |
|
Deep Tech Fund of Funds |
- Explored to catalyze the next generation startups |
|
PM Research Fellowship |
- 10,000 fellowships for technological research in IITs and IISc with enhanced financial support |
|
Gene Bank for Crops Germplasm |
- 2nd Gene Bank with 10 lakh germplasm lines for future food and nutritional security |
|
National Geospatial Mission |
- Develop foundational geospatial infrastructure and data |
|
Gyan Bharatam Mission |
- Survey, documentation, and conservation of manuscript heritage, Cover more than 1 crore manuscripts, Undertaken with academic institutions, museums, libraries, and private collectors |
EXPORTS AS THE 4th ENGINE OF DEVELOPMENT |
|
|
Export Promotion Mission |
|
|
Initiative |
Key Points |
|
Export Promotion Mission |
- Driven jointly by the Ministries of Commerce, MSME, and Finance, Sectoral and ministerial targets |
|
BharatTradeNet |
- Unified platform for international trade, Trade documentation and financing solutions |
|
National Framework for GCC |
- Guidance to states for promoting Global Capability Centres (GCCs), Focus on emerging tier 2 cities
|
|
Reforms as Fuel: Financial Sector Reforms and Development |
|
|
Initiative |
Key Points |
|
FDI in Insurance Sector |
- FDI limit raised from 74% to 100% for companies investing the entire premium in India |
|
Credit Enhancement Facility by NaBFID |
- NaBFID to set up a ‘Partial Credit Enhancement Facility’ for corporate bonds for infrastructure |
|
Grameen Credit Score |
- Public Sector Banks to develop ‘Grameen Credit Score’ framework - Serve the credit needs of SHG members and people in rural areas |
|
Pension Sector |
- Forum for regulatory coordination and development of pension products |
|
High Level Committee for Regulatory Reforms |
- Review of all non-financial sector regulations, certifications, licenses, and permissions |
|
Investment Friendliness Index of States |
- will be Launched in 2025 to further the spirit of competitive cooperative federalism |
|
Jan Vishwas Bill 2.0 |
- Decriminalize more than 100 provisions in various laws |
Part B: Direct Tax
Personal Income Tax
|
Initiative |
Key Points |
|
Tax-Free Income Limit |
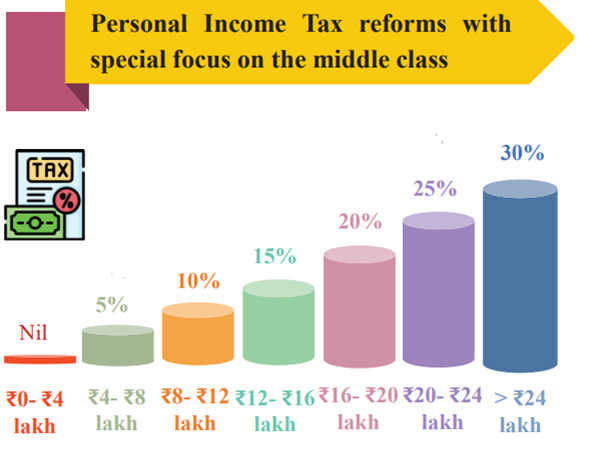
- No personal income tax payable up to income of ₹ 12 lakh (₹ 1 lakh per month) - Excludes special rate income such as capital gains |
|
Tax-Free Limit for Salaried Taxpayers |
- ₹ 12.75 lakh for salaried taxpayers due to standard deduction of ₹ 75,000 |
|
Benefits of New Structure |
- Substantially reduce taxes for the middle class, Boost household consumption, savings, and investment, Leave more money in the hands of the middle class |
|
New Income-Tax Bill |
- Clear and direct tex, Simple to understand for taxpayers and tax administration - Lead to tax certainty and reduced litigation |
|
Revenue Foregone |
- About ₹ 1 lakh crore in direct taxes |
Revised Tax Rate Structure
TDS/TCS Rationalization for Easing Difficulties
|
Initiative |
Key Points |
|
TDS Rationalization
|
- Reduction in the number of rates and thresholds above which TDS is deducted |
|
TDS Limit for Senior Citizens |
- Doubled from ₹ 50,000 to ₹ 1 lakh for tax deduction on interest |
|
TDS Limit on Rent |
- Increased from ₹ 2.40 lakh to ₹ 6 lakh annually |
|
TCS Threshold for LRS
|
Increased from ₹ 7 lakh to ₹ 10 lakh |
|
Higher TDS Deduction |
- Applies only in non-PAN cases |
|
Decriminalization of TCS Delay |
- Decriminalization for cases of delay in payment of TCS up to the due date of filing statement |
Reducing Compliance Burden
|
Initiative |
Key Points |
|
Small Charitable Trusts/Institutions |
- Increased registration period from 5 years to 10 years |
|
Self-Occupied Properties |
- Benefit of claiming the annual value as nil extended for two such properties without any condition |
Ease of Doing Business
|
Initiative |
Key Points |
|
Arm's Length Price Scheme |
- Scheme for determining arm's length price of international transactions for a block period of three years |
|
Safe Harbour Rules
|
Under this clause, a fund will be exempt if it does not have a business connection in India. |
|
National Savings Scheme (NSS) |
- Exemption of withdrawals made by individuals on or after August 29, 2024 |
|
NPS Vatsalya Accounts
|
- Similar treatment as normal NPS accounts, subject to overall limits |
Employment and Investment
|
Initiative |
Key Points |
|
Tax Certainty for Electronics Manufacturing |
- Presumptive taxation regime for non-residents providing services to resident companies establishing or operating electronics manufacturing facilities |
|
Safe Harbour for Tax Certainty |
- Introduction of a safe harbour for non-residents storing components for supply to specified electronics manufacturing units |
Tonnage Tax Scheme for Inland Vessels
|
Initiative |
Key Points |
|
Tonnage Tax Scheme Extension |
- Benefits of the existing tonnage tax scheme extended to inland vessels registered under the Indian Vessels Act, 2021, Promotes inland water transport in the country |
INDIRECT TAX
Rationalization of Customs Tariff Structure for Industrial Goods
|
Initiative |
Key Points |
|
Removal of Tariff Rates |
- 7 tariff rates removed (in addition to seven removed in 2023-24), 8 remaining tariff rates, including ‘zero’ rate |
|
Application of Cess |
- Appropriate cess to maintain effective duty incidence, Marginal reduction in incidence for a few items |
|
Levy of Cess/Surcharge |
- Not more than one cess or surcharge, Social Welfare Surcharge on 82 tariff lines exempted |
|
Revenue Foregone |
- About ₹ 2,600 crore in indirect taxes |
Relief on Import of Drugs/Medicines
|
Initiative |
Key Points |
|
Exemption from BCD (Basic Customs Duty) |
BCD refers to the tax imposed on the goods when they are transported across the international borders. The customs duty is levied under the Customs Act 1962. - 36 lifesaving drugs and medicines fully exempted from BCD - Specified drugs and medicines under Patient Assistance Programmes fully exempted - 37 more medicines added along with 13 new patient assistance programmes |
|
Concessional Customs Duty |
- 6 lifesaving medicines to attract concessional customs duty of 5% |
Support to Domestic Manufacturing and Value Addition
|
Initiative |
Key Points |
|
Critical Minerals |
- Cobalt powder and waste, scrap of lithium-ion battery, Lead, Zinc, and 12 more critical minerals fully exempted from BCD |
|
Textiles |
- 2 more types of shuttle-less looms fully exempted from textile machinery, BCD rate on knitted fabrics revised from “10% or 20%” to “20% or ₹ 115 per kg, whichever is higher” |
|
Electronic Goods |
- BCD on Interactive Flat Panel Display (IFPD) increased from 10% to 20%, BCD reduced to 5% on Open Cell and other components, BCD on parts of Open Cells exempted |
|
Lithium Ion Battery |
- 35 additional capital goods for EV battery manufacturing exempted - 28 additional capital goods for mobile phone battery manufacturing exempted |
|
Shipping Sector |
- Exemption of BCD on raw materials, components, consumables, or parts for the manufacture of ships extended for another 10 years, Same dispensation to continue for ship breaking |
|
Telecommunication |
- BCD reduced from 20% to 10% on Carrier Grade ethernet switches |
Export Promotion
|
Initiative |
Key Points |
|
Handicraft Goods |
- Time period for export extended from six months to one year, further extendable by another three months if required, 9 items added to the list of duty-free inputs |
|
Leather Sector |
- BCD on Wet Blue leather fully exempted, Crust leather exempted from 20% export duty
|
|
Marine Products |
- BCD reduced from 30% to 5% on Frozen Fish Paste (Surimi) for manufacture and export of its analogue products, BCD reduced from 15% to 5% on fish hydrolysate for manufacture of fish and shrimp feeds |
|
Domestic MROs for Railway Goods |
- Railways MROs to benefit similarly to aircraft and ships MROs in terms of import of repair items - Time limit extended for export of such items from 6 months to one year and made further extendable by one year |
Union Minister of Finance and Corporate Affairs Smt. Nirmala Sitharaman also said that Democracy, Demography and Demand are key pillars of Viksit Bharat journey. She said that the middle class gives strength of India’s growth and the Government has periodically hiked the ‘Nil tax’ slab in recognition to their contribution. She said the proposed new tax structure will substantially boost consumption, savings and investment, by putting more money in the hands of the middle class.

|
Also Read |
|
| NCERT Books For UPSC | |
| UPSC Monthly Magazine | Best IAS Coaching in Delhi |
India's 2027 Digital Census Notified
India’s Nuclear Liability Law Debate
Balancing Power and Trust in the Bay of Bengal
Karol Bagh Metro Pillar No. 112, Above Domino's, 22B, First Floor, New Delhi - 110060
Very Important Instruction For Any Issue, Student Must Produce His/Her Fee Receipt. Without Fee Receipt, It Will Not Be Possible To Track Your Details. If You Have Been Given Any Special Consideration, You Must Keep That In Writing And Produce In Case Of Conflict.
Copyright © 2024-2026 ENSURE IAS. All rights reserved.