- Courses
- GS Full Course 1 Year
- GS Full Course 2 Year
- GS Full Course 3 Year
- GS Full Course Till Selection
- Answer Alpha: Mains 2025 Mentorship
- MEP (Mains Enrichment Programme) Data, Facts
- Essay Target – 150+ Marks
- Online Program
- GS Recorded Course
- Polity
- Geography
- Economy
- Ancient, Medieval and Art & Culture AMAC
- Modern India, Post Independence & World History
- Environment
- Governance
- Science & Technology
- International Relations and Internal Security
- Disaster Management
- Ethics
- NCERT Current Affairs
- Indian Society and Social Issue
- NCERT- Science and Technology
- NCERT - Geography
- NCERT - Ancient History
- NCERT- World History
- NCERT Modern History
- CSAT
- 5 LAYERED ARJUNA Mentorship
- Public Administration Optional
- ABOUT US
- OUR TOPPERS
- TEST SERIES
- FREE STUDY MATERIAL
- VIDEOS
- CONTACT US
ECONOMIC SURVEY 2024-25
ECONOMIC SURVEY 2024-25
The Economic Survey provides a comprehensive analysis of India's economic trajectory. It highlights:
- Growth Trends: Covers India's economic progress and global optimism towards the nation.
- Sectoral Performance: Focuses on infrastructure, agriculture, industries, and futuristic sectors.
Who Prepares the Economic Survey?
- Prepared by the Economic Division of the Department of Economic Affairs (DEA), Ministry of Finance.
- Compiled under the guidance of the Chief Economic Advisor (CEA).
Presentation & Preparation
- Released one day before the Union Budget.
- Summarizes annual economic developments and outlines short- and medium-term economic prospects.
- Presented in Parliament ahead of the Budget for the upcoming financial year.
Policy Perspective to Budget
- Serves as a flagship document of the Ministry of Finance.
- Provides detailed statistical data covering various economic aspects.
- Acts as an authoritative guide to the Indian economy and sets the policy context for the Union Budget.
Economic Landscape
The Survey analyzes key economic indicators, enabling better resource mobilization and allocation in the Budget. It covers: Agriculture & Industrial Production, Infrastructure Development, Employment Trends, Money Supply & Financial Markets, and Trade & Foreign Exchange Reserves
How is the Economic Survey Related to the Budget?
- Identifies economic challenges and opportunities, helping in policy formulation.
- Provides insights into economic trends that influence Budget allocations and priorities.
- Aids in better fiscal planning by offering a macroeconomic perspective.
|
Chapter-1. State of the Economy: Getting Back into the Fast Lane |
Global Economic Scenario
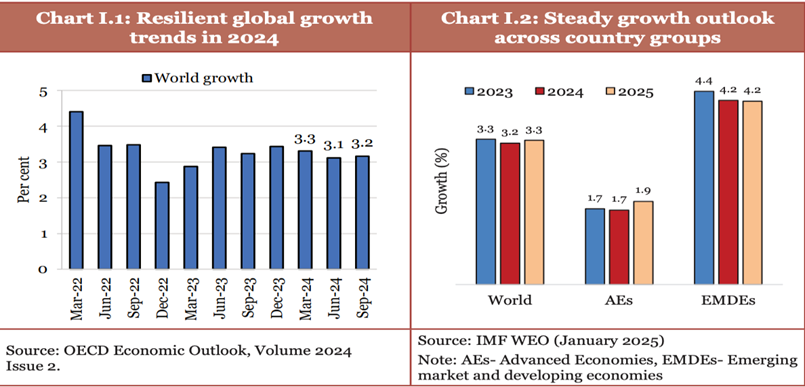
- Growth Trends: The global economy grew by 3.3% in 2023, with the IMF projecting 3.2% growth for the next five years.
- Manufacturing Slowdown: Weak external demand and supply chain disruptions led to a slowdown, especially in Europe and parts of Asia.
- Services Sector: Outperformed other sectors, supporting global economic growth.
Key Global Challenges
- Inflationary Pressures: Inflation rates are approaching central bank targets, though services inflation remains persistent while core goods inflation has declined significantly.
- Geopolitical & Trade Uncertainty:
- Tensions in the Middle East have disrupted Suez Canal trade, affecting 15% of global maritime trade.
- Geopolitical Economic Policy Uncertainty Index rose from 121.7 (2023) to 133.6 (2024), reflecting global economic policy concerns.
- World Trade Uncertainty Index increased from 8.5 (2023) to 13 (2024) due to trade tensions and shifting policies in major economies.
Indian Economy
Growth & Demand Trends
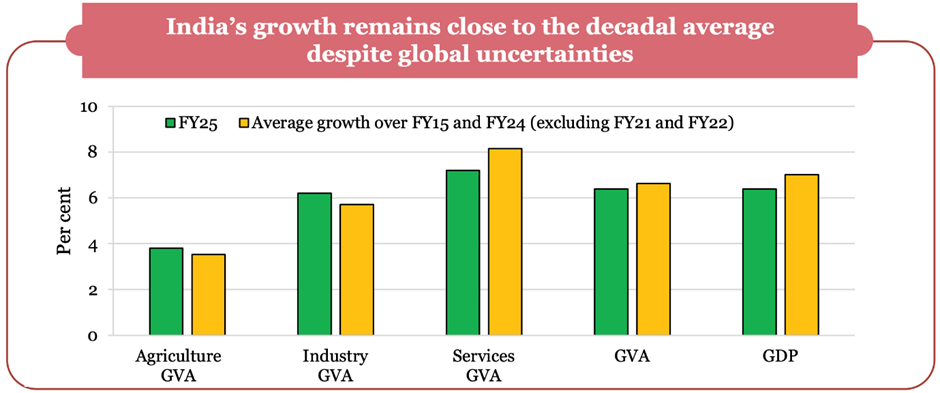
- Real GDP Growth: Estimated at 6.4% in FY25, aligning with the decadal average.
- Private Consumption: Expected to grow by 7.3%, supported by a rebound in rural demand.
- Real Gross Value Added (GVA): Projected at 6.4% growth in FY25.
Sectoral Performance
- Agriculture: Expected to rebound to 3.8% growth.
- Industry: Estimated to grow by 6.2%, supported by strong growth in construction and utility services.
- Services: Forecasted at 7.2% growth, driven by financial, real estate, professional, and public services.
Economic Indicators
- Manufacturing Strength: India continues to lead in manufacturing PMI growth.
- Services Expansion: PMI services remain strong, supported by rising orders, sales, and employment.
- Inflation: Retail inflation (CPI) softened from 5.4% (FY24) to 4.9% (Apr-Dec 2024).
- Capital Expenditure (CAPEX): Increased consistently since FY21, with 8.2% YoY growth (Jul-Nov 2024) post-elections.
External Sector
- Global Trade Share: India ranks seventh in global services exports, highlighting its competitiveness.
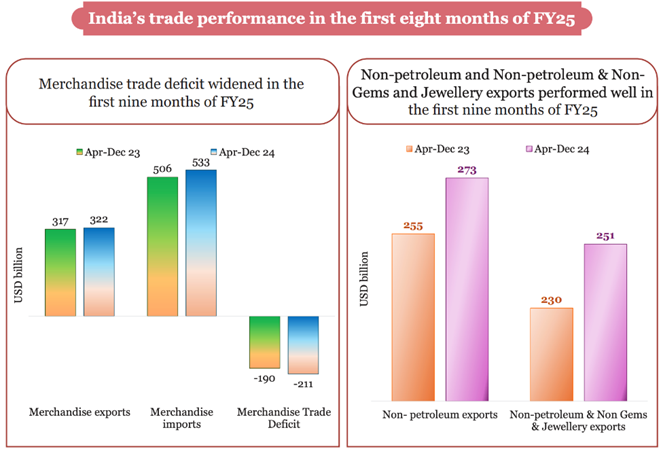
- Resilient Exports: Non-petroleum, non-gems & jewellery exports grew 9.1% (Apr-Dec 2024) despite global volatility.
Employment Trends
- Unemployment Rate: Declined from 6% (2017-18) to 3.2% (2023-24) (PLFS report).
- Formal Sector Growth: EPFO subscriptions surged from 61 lakh (FY19) to 131 lakh (FY24), indicating expanding employment opportunities.
|
Chapter-2. Monetary and Financial Sector Developments: The Card and the Horse |
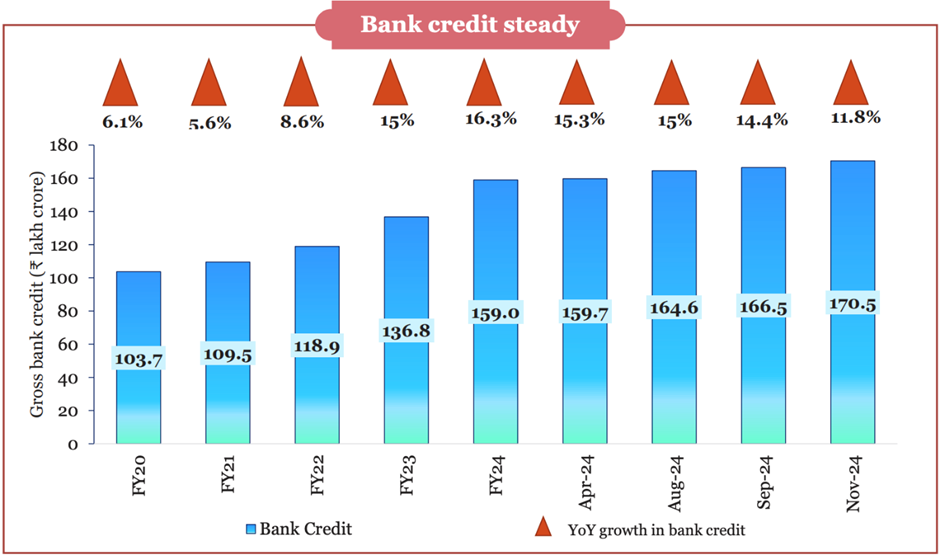
- Steady Credit Growth: Bank credit continues to expand at a stable pace, aligning with deposit growth.
- Improved Profitability: Scheduled Commercial Banks (SCBs) have witnessed higher profitability, with declining Gross Non-Performing Assets (GNPAs) and a rising Capital-to-Risk Weighted Asset Ratio (CRAR).
Banking Sector Performance & Credit Availability
- Credit Growth: For two consecutive years, credit growth has exceeded nominal GDP growth.
- The credit-GDP gap narrowed from (-)10.3% in Q1 FY23 to (-)0.3% in Q1 FY25.
- Asset Quality: GNPAs of SCBs declined from their peak in FY18 to 2.6% (Sept 2024).
- Capital Strength: SCBs' CRAR stood at 16.7%, with all banks meeting the Common Equity Tier-1 (CET-1) requirement of 8%.
- Global Comparison:
- India’s bank credit to GDP ratio is lower than advanced economies like the US, UK, and Japan.
- Among emerging markets, it remains lower than some but higher than Indonesia and Mexico.
- Rural Banking Expansion: Regional Rural Banks (RRBs) increased their branches from 14,494 (2006) to 21,856 (2023).
- Financial Inclusion: RBI’s Financial Inclusion Index rose from 53.9 (March 2021) to 64.2 (March 2024), reflecting broader financial access.
Capital Market Developments
- Primary Market Mobilization: ₹11.1 lakh crore was raised via equity and debt markets (Apr-Dec 2024), a 5% increase over FY24.
- Demat Accounts Growth: Rose 33% YoY, reaching 18.5 crore (Dec 2024).
- IPO Surge: 259 IPOs launched (Apr-Dec 2024), up 32.1% YoY from 196 (2023).
- Stock Market Capitalization: BSE market cap to GDP ratio stood at 136% (Dec 2024), significantly higher than China (65%) and Brazil (37%).
Insurance Sector Developments
- Total Premium Growth: Increased 7.7% in FY24, reaching ₹11.2 lakh crore.
- Insurance Penetration: Declined from 4% (FY23) to 3.7% (FY24).
- Life Insurance: Dropped slightly from 3% to 2.8%.
- Non-Life Insurance: Remained stable at 1%.
Pension Sector Developments
- Subscriber Growth: 16% YoY increase, reaching 783.4 lakh (Sept 2024) from 675.2 lakh (Sept 2023).
- Pension Index Decline: India's Mercer CFA Institute Global Pension Index score fell from 45.9 (2023) to 44 (2024).
Cybersecurity in the Financial Sector
- Cyber Risks on the Rise: Nearly 20% of all reported cyber incidents involve financial institutions, with banks being the most affected.
- Financial Impact: Cyberattacks caused $2.5 billion in losses, a fourfold increase since 2017 (IMF Global Financial Stability Report).
Effectiveness of Insolvency Law
- Resolution Under IBC: ₹3.6 lakh crore recovered from 1,068 resolution plans (Sept 2024).
- This represents 161% of liquidation value and 86.1% of fair asset value.
|
Chapter-3. External Sector: Getting FDI Right |
External Sector: Getting FDI Right
India’s external sector has remained resilient despite global trade uncertainties and economic challenges.
Global Trade Dynamics
- Red Sea Disruptions: Since November 2023, trade route adjustments have led to higher shipping costs and delays.
- Hormuz Strait Tensions: Disruptions in the world’s key oil transit route (21% of global petroleum trade) have increased energy prices.
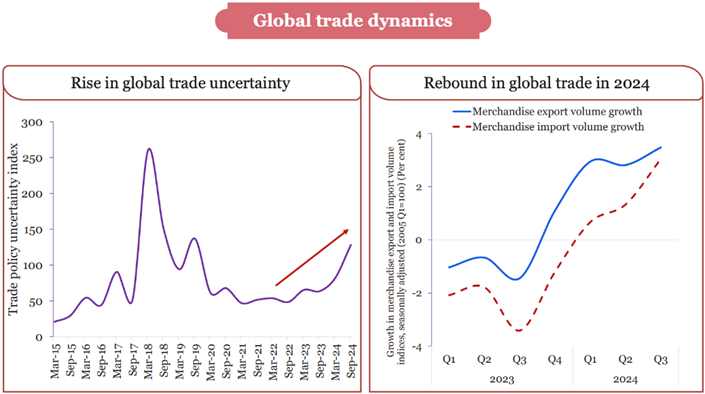
- Climate Impact: Drought in the Panama Canal has hindered 5% of global maritime trade.
- Rise in Trade Alliances: Since 2022, countries have increasingly preferred bilateral trade agreements over multilateral deals.
Global Trade Performance (2024)
- WTO Data (Q3 2024):
- Merchandise Exports grew 3.5% YoY; Merchandise Imports rose 3% YoY.
- Global Services Trade saw 7.9% export growth and 6.7% import growth.
Tariff and Non-Tariff Policies
- Lower Tariffs:
- India's average tariff rate on dutiable items declined from 48.9% (2000) to 17.3% (2024).
- China's tariffs dropped from 16.4% to 8.3% over the same period.
- Non-Tariff Measures (NTMs):
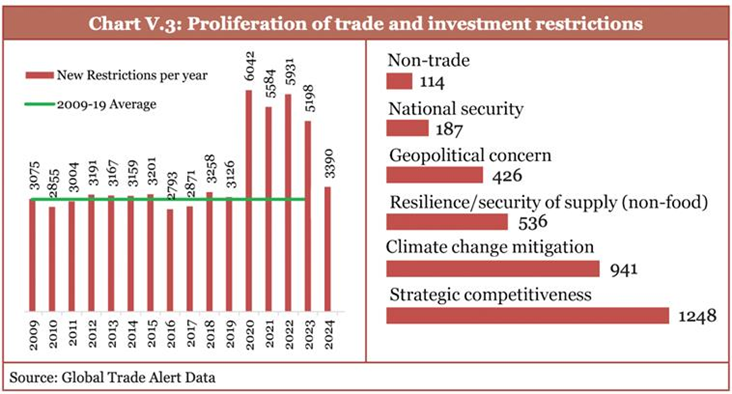
- 26,000+ new trade and investment restrictions were imposed worldwide between 2020-2024 (Global Trade Alert).
- Sectors most affected: Agriculture, Manufacturing, and Natural Resources.
India’s Trade Performance
- Export Growth: Overall exports (merchandise + services) grew 6% YoY (FY25, first nine months).
- Services sector expanded 11.6%.
- Import Growth: Imports rose 6.9%, reaching USD 682.2 billion, fueled by domestic demand.
- Global Market Share: India holds 10.2% of global exports in Telecommunications, Computer, & Information Services, ranking as the 2nd largest exporter (UNCTAD).
India’s Balance of Payments
- Current Account: CAD stood at 1.2% of GDP (Q2 FY25), backed by strong net services receipts and higher private transfers.
- Capital & Financial Account: Surpluses recorded from Q1 FY23 to Q2 FY25, driven by strong FDI, FPI, and external borrowings.
Foreign Direct Investment (FDI) Performance
- FDI Inflows: Increased 17.9% in FY25 compared to FY24.
- Cumulative FDI (2000-2024): Surpassed USD 1 trillion (April 2000 - September 2024).
Foreign Exchange Reserves
- Composition: Includes foreign currency assets (FCA), gold, SDRs, and IMF reserve positions.
- Current Level: Stood at USD 640.3 billion (Dec 2024), covering 10.9 months of imports and 90% of external debt.
India’s External Debt: Stable Debt Levels: The external debt-to-GDP ratio remained at 19.4% (Sept 2024), indicating a manageable debt burden.
|
Chapter-4. Prices and Inflation: Understanding the Dynamics |
- Global Inflation fell from 8.7% (2022) to 5.7% (2024) (IMF).
- Core Inflation reached its lowest level in a decade.
Domestic Inflation Trends
- Retail Inflation in India declined from 5.4% (FY24) to 4.9% (FY25, Apr-Dec 2024).
- Key Factors:
- Core Inflation dropped by 0.9 percentage points, mainly due to lower core services inflation and reduced fuel price inflation.
- Core services inflation declined more than core goods inflation, leading to overall moderation.
Food Inflation Trends
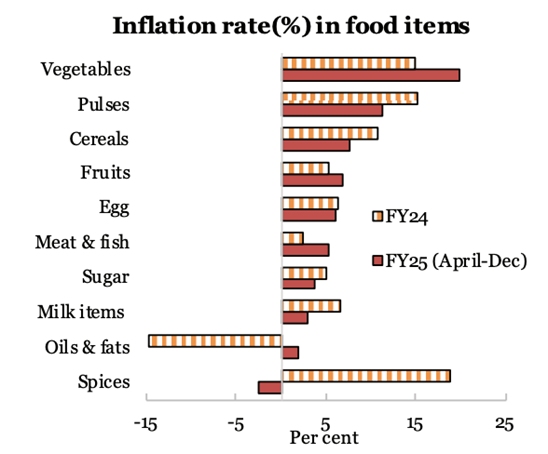
- Persistent Inflation: Food prices remained high due to extreme weather events (cyclones, heavy rains, droughts, heatwaves) affecting vegetable production (onions, tomatoes) and supply chains.
- Consumer Food Price Index (CFPI) rose from 7.5% (FY24) to 8.4% (FY25), mainly driven by vegetables and pulses.
- Adjusted Food Inflation: Excluding Tomato, Onion, and Potato (TOP), the average food inflation in FY25 was 6.5%.
Government Measures to Control Food Inflation
- Cereals:
- Stock limits imposed on wheat.
- Wheat and rice released from central stocks via the Open Market Sale Scheme.
- Bharat brand introduced for affordable wheat flour and rice.
- Pulses:
- Chana dal, moong dal, and masur dal sold at subsidized rates under Bharat brand.
- Stock limits placed on tur and desi chana.
- Duty-free imports of desi chana, tur, urad, masur, and yellow peas allowed.
- Vegetables:
- Onion buffer stock of 4.7 lakh MT (rabi onion) procured under the Price Stabilisation Fund.
- Subsidized sale of onions and tomatoes.
|
Chapter-5. Medium Term Outlook: Deregulation Drives Growth |
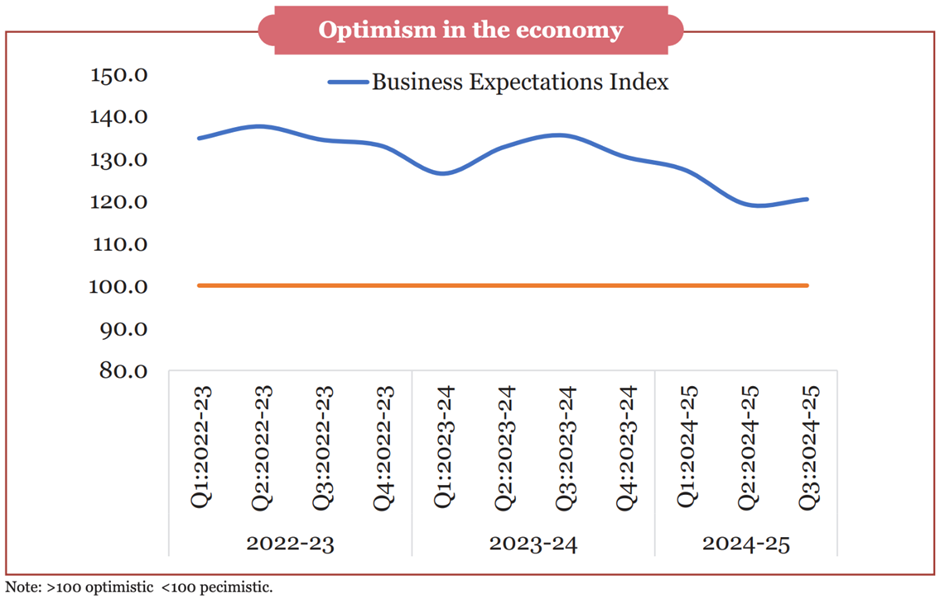
- To achieve Viksit Bharat by 2047, India must sustain an 8% GDP growth rate over the next two decades.
- The IMF's World Economic Outlook forecasts India's economy to reach USD 5 trillion by FY28 and USD 6.3 trillion by FY30.
- India's medium-term growth will be shaped by geo-economic fragmentation (GEF), China's dominance in manufacturing, and the energy transition’s dependence on China.
Geo-Economic Fragmentation (GEF): A New Global Reality
- GEF refers to the policy-driven reversal of globalization, causing economic realignments.
- It disrupts trade, capital, and migration flows, reshaping global economic dynamics.
- China's Dominance:
- Manufacturing: By 2030, China is expected to control 45% of global manufacturing (UNIDO), surpassing the US and allies.
- Energy Transition Technologies: China commands 80% of the global solar panel supply chain and a major share of battery production.
Impact of GEF
- Increase in Trade and Investment Restrictions: Over 24,000 new trade and investment restrictions were implemented globally between 2020-2024.
- Shifting FDI Patterns: Foreign Direct Investment (FDI) is increasingly concentrated among geopolitically aligned nations, making emerging markets more vulnerable.
Deregulation and Economic Freedom: A Growth Catalyst
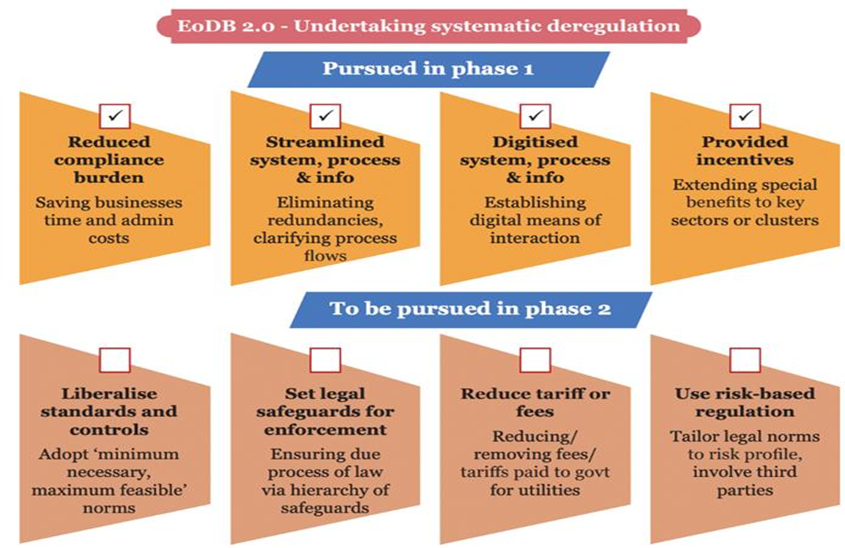
- Systematic deregulation can enhance growth by reducing unnecessary constraints on businesses.
- Three-step approach for states to drive deregulation:
- Identifying regulatory hurdles under Ease of Doing Business (EoDB) 2.0, with a focus on developing a strong SME (Mittelstand) sector.
- Benchmarking regulations against other states and countries.
- Evaluating the cost burden of regulations on businesses.
|
Chapter-6. Investment and Infrastructure: Keeping it Going |
- Over the past five years, the government has prioritized public investment in infrastructure, spanning physical, digital, and social sectors.
- Capital expenditure on key infrastructure sectors has grown at an annual rate of 38.8% from FY20 to FY24.
Infrastructure Developments Across Sectors
- Physical Infrastructure
- Railways
- Expansion & Modernization:
- 17 new pairs of Vande Bharat trains were introduced between April and October 2024.
- 91 Gati Shakti multi-modal cargo terminals became operational.
- Sustainability Goals: Indian Railways aims to generate 30 GW of renewable energy by 2030.
- Key Projects:
- Automatic Block Signaling enhances efficiency on high-density routes.
- Mumbai-Ahmedabad High-Speed Rail (508 km), initiated in 2015 with Japanese collaboration, is progressing.
- Roads
- India’s Road Network:
- 63.4 lakh km total road length, with 146,195 km of National Highways (NH) carrying 40% of freight traffic.
- 5,853 km of NH constructed in FY25.
- Major Initiatives:
- Bharatmala Pariyojana (2017) aims to develop 34,800 km of NH; 76% of projects awarded, and 18,926 km completed.
- Multi-Modal Logistics Parks (MMLP): Six locations—Chennai, Indore, Nagpur, Jalna, Jogighopa, and Bengaluru—awarded till December 2024.
- Civil Aviation
- Growing Cargo Capacity: 8 million MT handled in FY24.
- UDAN Scheme: 619 routes operationalized, linking 88 airports, 2 water aerodromes, and 13 heliports.
- Ports, Shipping & Inland Waterways
- Operational Efficiency:
- Average container turnaround time reduced from 48.1 hours in FY24 to 30.4 hours in FY25 (April-November).
- Key Developments:
- Sagarmala Programme focuses on port modernization and industrialization.
- Chabahar Port & INSTC enhance trade between Mumbai and Eurasia.
- Harit Nauka Guidelines (2024) aim to transition 1,000 inland vessels to green energy over the next decade.
- FY24 witnessed a 43% rise in vessel traffic and 34% growth in container traffic.
- Energy Infrastructure
- Power Sector
- Capacity Expansion:
- Total installed power capacity reached 456.7 GW (Nov 2024), growing at 7.2% YoY.
- Renewable energy’s share now stands at 47% of total installed capacity.
- Renewable energy capacity surged 15.8% YoY, reaching 209.4 GW (Dec 2024).
- Key Policies:
- Revamped Distribution Sector Scheme and SAUBHAGYA aim to enhance power accessibility.
- Digital Infrastructure
- Telecommunications
- 5G Expansion: By October 2024, 5G services covered all states and UTs.
- Key Initiative: BharatNet Project ensures broadband access in rural areas.
- IT & Data Centers
- Cloud Computing Growth: National Informatics Centre (NIC) manages 1,917 cloud applications under MeghRaj GI Cloud Initiative.
- Data Center Market: Expected to grow from USD 4.5 billion (2023) to USD 11.6 billion (2032).
- Rural & Urban Infrastructure
- Rural Drinking Water & Sanitation
- Jal Jeevan Mission (2019):
- 12 crore households now have access to piped drinking water.
- 100% coverage in Arunachal Pradesh, Goa, Haryana, Himachal Pradesh, Gujarat, Punjab, Telangana, Mizoram, and three UTs.
- Swachh Bharat Mission Phase II – Grameen:
- 1.92 lakh villages declared ODF+ in 2024, bringing the total to 3.64 lakh ODF+ villages.
- Urban Development
- Pradhan Mantri Awas Yojana - Urban (2015): 89 lakh houses completed.
- Urban Transport:
- Metro and rapid rail projects operational or under construction in 29 cities.
- 1,010 km of metro operational in 23 cities.
- AMRUT Scheme:
- Tap water coverage increased to 70%, and sewerage coverage reached 62%.
Strategic Infrastructure
- Tap water coverage increased to 70%, and sewerage coverage reached 62%.
- Tourism
- PRASHAD Scheme: Enhancing infrastructure at pilgrimage destinations.
- Swadesh Darshan 2.0 (2022):
- 75 out of 76 projects completed as of December 2024.
- 26 out of 48 heritage projects completed.
- Space Sector
- India's Space Assets: 56 active satellites: 19 communication, 9 navigation, 4 scientific, and 24 earth observation satellites.
- Vision 2047 Initiatives:
- Bhartiya Antariksh Station through Gaganyaan follow-up missions.
- Chandrayaan-4 Lunar Sample Return Mission & Venus Orbiter Mission.
- Next-Gen Launch Vehicle development.
|
Chapter-7. Industry: Business Reforms & Growth |
- The manufacturing sector is projected to grow 6.2% in FY25, led by electricity and construction.
- India’s global manufacturing share stands at 2.8%, significantly lower than China’s 28.8%, highlighting vast growth potential.
Core Input Industries
Cement: Second-largest producer globally, but per capita consumption is 290 kg, far below the global average of 540 kg.
Steel
- Demand is rising due to expanding end-user industries and policies like the National Steel Policy and PLI schemes.
- Steel Scrap Recycling Policy promotes efficient reuse, essential for transitioning to green steel.
Chemical & Petrochemical Industry: India imports 45% of its petrochemical intermediates, making self-sufficiency a key focus.
Capital Goods
- Technology gaps force India to import advanced machinery.
- Government initiatives like Smart Manufacturing and Industry 4.0 aim to modernize production through SAMARTH Udyog centers.
Automobile Industry
- Domestic sales increased by 12.5% in FY24, boosting economic growth.
- The PLI scheme for automobiles has been extended by a year to support expansion.
Electronics
- 99% of smartphones sold in India are now locally manufactured, reducing import reliance.
- Make in India and Digital India initiatives have attracted foreign investment.
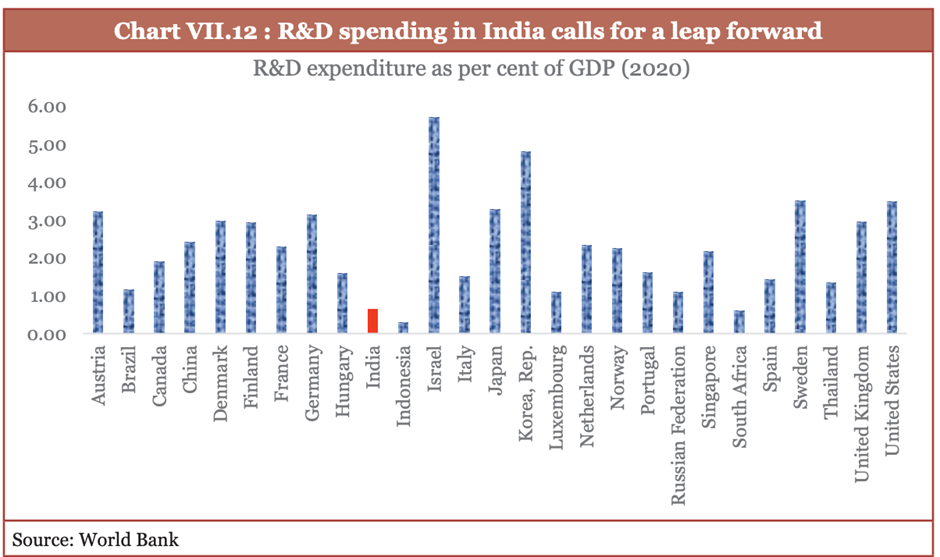
- However, India holds only 4% of the global electronics market, primarily focusing on assembly rather than design and core components.
Textiles
- Contributes 11% to manufacturing GVA, ranking second globally in cotton, silk, and man-made fiber.
- India is the sixth-largest textile exporter with 4% of global trade.
- Technical textiles hold strong growth potential, ranking fifth globally.
- Challenges:
- MSME dominance limits scalability and efficiency.
- Fragmentation increases logistics costs.
- Cotton reliance reduces competitiveness.
- Limited FDI, outdated technology, imported machinery, and a skill gap affect productivity and innovation.
Pharmaceuticals
- Third-largest globally by volume, growing at 10.1% annually over five years.
- PLI schemes & SPI initiatives aim to reduce import dependence.
- India is advancing in cell & gene therapy, with its first indigenous CAR-T cell therapy approved.
- Clinical trial waivers for drugs approved in the USA, UK, Japan, Australia, Canada, and EU expedite new treatments.
MSME Sector
- A key economic driver, generating employment with low capital costs.
- Government support programs:
- Self-Reliant India Fund and MSME-Cluster Development Programme.
- Credit Guarantee Scheme for better credit access.
- MSME Samadhan & CHAMPIONS portals to resolve industry challenges.
State-Wise Industrial Production
- Gujarat, Maharashtra, Karnataka, and Tamil Nadu contribute 43% of India’s industrial output.
- The northeastern states account for just 0.7%, highlighting regional imbalances.
|
Chapter-8. Services: Adapting to New Challenges |
Services:
- The service sector now contributes 55.3% to India's GVA in FY25, up from 50.6% in FY14.
- India ranks 7th globally in services exports, holding a 4.3% market share (2023).
- It provides employment to nearly 30% of the workforce.
Service Sector Performance in India
- Services support GDP not only directly but also through servicification of manufacturing, where industries increasingly rely on services for production and value addition.
- Major service industries include trade, hotels, restaurants, transport, communication, finance, and real estate.
Trade in Services
- Computer & business services dominate, accounting for nearly 70% of India's services exports.
- India remains among the top five fastest-growing services-exporting nations in FY25.
Logistics & Physical Connectivity Services
Railways
- India has the 4th largest railway network globally.
- Passenger traffic grew 8% in FY24, while freight revenue rose by 5.2%.
Road Transport: The largest contributor to transport GVA, accounting for 78% of the sector.
Aviation: India is the world’s fastest-growing aviation market.
Ports, Waterways & Shipping
- India aims to become a top-five player in shipbuilding & repair by 2047 through Maritime India Vision 2030 and Maritime Amritkaal Vision 2047.
- Inland waterways span 14,850 km, with 4,800 km currently operational across 26 waterways.
Tourism & Hospitality
- The sector's GDP contribution returned to 5% in FY23, creating 7.6 crore jobs.
- India ranked 14th in world tourism receipts (2023), with 1.8% of global earnings.
Real Estate: Post Real Estate Regulatory Authority (RERA) implementation, India now ranks 31st out of 89 countries in the Global Real Estate Transparency Index (2024).
IT, Telecom & Emerging Services
- IT & Computer Services: Grew at an average 12.8% annually over the past decade (FY13–FY23), raising its GVA share from 6.3% to 10.9%.
- Global Capability Centres (GCCs): India is a leading hub for GCCs, with over 1,700 centers operating in FY24, transforming the corporate landscape.
- Telecommunication
- India is the second-largest telecom market with an 84% teledensity.
- Offers the world’s lowest data rates and achieved the fastest 5G rollout globally.
State-Wise Service Sector Performance
- The service sector contributes 55% to national GVA but varies across states.
- In FY23, Karnataka & Maharashtra alone accounted for over 25% of India’s total service sector GSVA.
- Meanwhile, 19 states combined contributed just 25% to the sector's GSVA.
|
Chapter-9. Agriculture and Food Management: A Sector Poised for the Future |
- The agriculture and allied sector contributes ~16% to India's GDP (FY24 PE) and supports 46.1% of the population.
- High-value sectors like horticulture, livestock, and fisheries are driving growth.
- India produces 11.6% of global cereals, yet yields remain lower than other top producers.
- The MSP for Arhar and Bajra has been raised by 59% and 77%, respectively, over the weighted cost of production for FY25.
Seeds & Fertilizers: Enhancing Productivity
- In 2023-24, ICAR produced 1.06 lakh quintals of breeder seeds across 1,798 varieties for 81 crops.
- Key initiatives: Seed banks, 'Urea Gold' (urea + sulfur for better absorption), PM PRANAM (reducing chemical fertilizer use).
Irrigation & Rainfall: Expanding Coverage & Efficiency
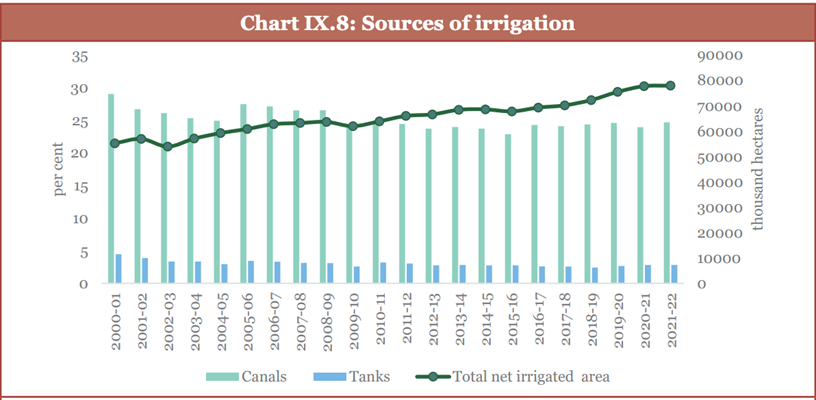
- Only 55% of India's net sown area is irrigated, and over two-thirds of agricultural land faces drought risks.
- Key interventions: Per Drop More Crop (PDMC) under PMKSY, Micro Irrigation Fund (MIF), Rain-fed Area Development (RAD).
Agriculture Credit: Strengthening Financial Support
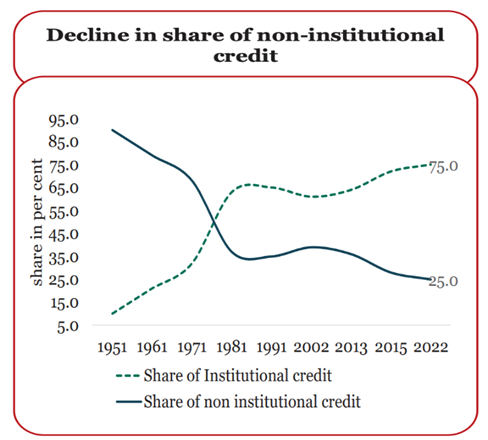
- 7.75 crore Kisan Credit Card (KCC) accounts exist, expanded in 2018-19 to cover fisheries & animal husbandry.
- Key initiatives: Modified Interest Subvention Scheme (MISS), Prompt Repayment Incentive (PRI), PM Fasal Bima Yojana (PMFBY), PM-KISAN.
Farm Mechanization: Improving Access
- High machinery costs hinder adoption among small & marginal farmers.
- Key schemes: Sub-Mission on Agricultural Mechanization (SMAM), Custom Hiring Centres (CHCs), Farm Machinery Banks, Drone Technology for Women SHGs.
Agricultural Extension: Spreading Knowledge
- Essential for boosting productivity and sustainable farming.
- Initiative: Sub-Mission on Agricultural Extension (SMAE) to improve entrepreneurship and knowledge dissemination.
Agriculture Marketing: Strengthening Infrastructure
Key schemes: Agriculture Marketing Infrastructure (AMI), Agriculture Infrastructure Fund (AIF), e-NAM for better market access.
Climate-Resilient Agriculture
- A 2°C rise in temperature and 7% increase in rainfall by 2099 could cause an 8-12% drop in productivity.
- Key programs: National Mission for Sustainable Agriculture, Paramparagat Krishi Vikas Yojana (PKVY), Mission Organic Value Chain Development for the Northeast (MOVCDNER).
Allied Sectors: Enhancing Resilience
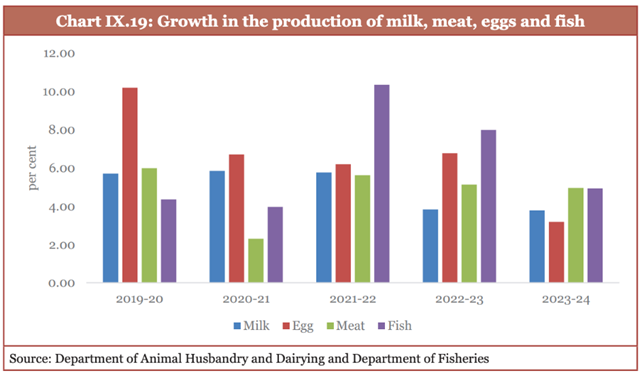
- Fisheries lead with an 8.7% CAGR, followed by livestock at 8% CAGR.
- Key initiatives: Rashtriya Gokul Mission, Livestock Health & Disease Control Program, PM Matsya Sampada Yojana (PMMSY), Fisheries & Aquaculture Infrastructure Development Fund (FIDF).
Cooperatives: Institutional Strengthening
- Cooperatives play a crucial role in agriculture, credit, banking, housing, and women's welfare.
- Key interventions: Model Bye-Laws for Primary Agricultural Credit Societies (PACS), PACS as Common Service Centres (CSCs), retail fuel outlets, micro-ATMs in cooperatives.
Food Processing: Driving Economic Growth
- Employs 12.41% of the organized sector workforce.
- Agri-food exports make up ~11.7% of total exports, with processed food exports rising from 14.9% (FY18) to 23.4% (FY24).
- Key programs: PM Kisan Sampada Yojana, Production Linked Incentive Scheme for Food Processing (PLISFPI), PM Formalization of Micro Food Processing Enterprises (PMFME).
Food Security & Management
Major programs: National Food Security Act (NFSA), PM Garib Kalyan Anna Yojana, Credit Guarantee Scheme for e-NWR-based Pledge Financing (CGS-NPF) for post-harvest lending.
|
Chapter-10. Climate and Environment: The Need for Adaptation |
- India's per capita carbon emissions are just one-third of the global average, despite being a rapidly growing economy.
- The Forest Survey of India 2024 reports an additional carbon sink of 2.29 billion tonnes CO₂ equivalent created between 2005 and 2021.
Prioritizing Climate Adaptation
- India ranks 7th among the most climate-vulnerable nations.
- Adaptation spending increased from 3.7% of GDP in FY16 to 5.6% in FY22, primarily funded domestically.
- Global climate finance is skewed towards mitigation, leaving adaptation efforts underfunded.
- The National Adaptation Plan (NAP) is being developed by the MoEFCC to define India’s adaptation priorities.
Building Climate Resilience Across Sectors
- Agriculture Adaptation: Focus on climate-resilient seeds, groundwater conservation, soil health improvement, and modified cropping practices.
- Urban Resilience
- Cities face heat stress, urban flooding, and declining groundwater.
- Key initiatives: National Mission on Sustainable Habitat (NMSH), AMRUT, Smart City Mission, Urban River Management Plan, River Cities Alliance (RCA).
- Coastal Adaptation
- India's coastline is vulnerable to heavy rains, storms, and tidal flooding.
- Key measures: Mangrove Initiative for Shoreline Habitats & Tangible Incomes (MISHTI), Conservation and Management of Mangroves and Coral Reefs, Coastal Regulation Zones.
- Water Management Adaptation
- Key interventions: Jal Shakti Abhiyan, National Aquifer Mapping Project (NAQUIM), Bhu-Neer portal, Flood Watch India app.
Energy Transition: Lessons & Strategies
- India depends heavily on coal (10% of global reserves) but has limited natural gas (0.7%).
- Non-fossil energy capacity stands at 2,13,701 MW, making up 46.8% of total generation.
- Key energy transition schemes:
- Solar Power Scheme for Tribal & PVTG Villages (PM JANMAN, DA JGUA)
- PM Surya Ghar Muft Bijli Yojana
- Viability Gap Funding (VGF) for Offshore Wind Energy
- Green Energy Corridor (GEC), National Bioenergy Programme, PM-KUSUM, National Green Hydrogen Mission
- Lesson learned: Developed nations warn against shutting down thermal power without stable alternatives.
- Green finance regulations: SEBI mandates Business Responsibility & Sustainability Reporting (BRSR), Green Debt Securities, and Sovereign Green Bonds (SGrBs).
Sustainable Lifestyles for Climate Action
- LiFE Mission (COP26, 2021) promotes eco-friendly living.
- Food waste contributes to >8% of global greenhouse gas emissions, with 17% of available food wasted annually.
- By 2030, LiFE actions could save $440 billion globally.
- Key initiatives: PM KUSUM, PM Surya Ghar Muft Bijli Yojana, Ecomark, Go Electric campaign, PAT scheme, Ek Ped Maa Ke Naam, Green Credit Programme.
Circular Economy & Resource Efficiency
- Resource circularity could save 11% of GDP by 2030 and 30% by 2050.
- Key measures: Tax benefits, subsidies, low-interest loans for recycling, and Extended Producer Responsibility (EPR) framework.
- Plastic pollution: India’s per capita plastic use is 14 kg, far below the global average of 35 kg. By 2050, plastics could contribute 15% of global emissions.
- Air pollution: 99% of the global population breathes unsafe air, with low- and middle-income countries most affected.
- Key initiatives: National Clean Air Programme (NCAP), Graded Response Action Plan, Crop Residue Management in Punjab, Haryana, UP & Delhi.
|
Chapter-11. Social Sector : Expanding Reach and Empowering Communities |
- Sustainable and inclusive economic growth is key to India's Viksit Bharat 2047 vision.
- Development requires investment in education, health, social security, and skill-based employment opportunities.
Rising Social Services Expenditure
- Government spending on social services has consistently increased since FY17, with a 15% CAGR from FY21 to FY25.
- Education expenditure grew at 12% CAGR.
- Health expenditure increased at 18% CAGR.
Key Outcomes
- Reduced Urban-Rural Gap: Monthly per capita expenditure (MPCE) fell from 84% (2011-12) to 70% (2023-24).
- Declining Inequality: Gini coefficient improved in rural areas (0.237 in 2023-24 from 0.266 in 2022-23) and urban areas (0.284 from 0.314).
Education: Strengthening the Foundation
- Major Initiatives: New Education Policy (2020), NISHTHA (teacher training), DIKSHA, PM SHRI, PM POSHAN.
- Early Childhood Education: Programs like Aadharshila, Navchetana, and National Framework for Early Childhood Stimulation.
- Progress:
- Primary-level Gross Enrollment Ratio (GER) is nearly universal (93%).
- Higher education GER improved from 23.7% (2014-15) to 28.4% (2021-22).
- Digital Learning Initiatives: SWAYAM, e-VIDYA, Artificial Intelligence in education.
Healthcare: Expanding Access & Affordability
- Government health expenditure share increased from 29% to 48%.
- Rising health concerns: Mental health issues in children and adolescents, and an increase in non-communicable disease (NCD) deaths (from 37.9% in 1990 to 61.8% in 2016).
- Lower out-of-pocket expenses: Share in total health expenditure declined from 62.6% to 39.4%.
- Key Health Initiatives:
- Ayushman Bharat PM-JAY, Jan Aushadhi scheme, SDG Localisation in healthcare.
- Tech-driven healthcare: U-WIN, E-Sanjeevani, Ayushman Bharat Digital Mission (ABDM), ICMR's 'i-DRONE' for North-East outreach.
Rural Infrastructure Development
- Roads: 99.6% of target habitations connected under PM Gram Sadak Yojana (PMGSY).
- PM-JANMAN, a dedicated tribal road connectivity vertical, was introduced under PMGSY.
- Housing: 2.69 crore homes built under PMAY-G since 2016.
- Water Resources: 68,843 Amrit Sarovars constructed under Mission Amrit Sarovar.
- Drinking Water: 12.2 crore tap water connections provided under Jal Jeevan Mission.
Localising SDGs for Inclusive Growth
- Gram Panchayat Development Plans under Mission Antyodaya & Transformation of Aspirational Districts Programme (TADP).
- Gender Inclusion: Gender Resource Centres (GRCs) and Gender Point Persons (GPPs) for local-level gender equity.
Boosting Rural Incomes & Employment
-
- Rural Livelihoods (DAY-NRLM)
- Empowering Women & SHGs:
- 10.05 crore rural households mobilized into 90.90 lakh SHGs.
- 1.37 lakh SHG members trained as Banking Correspondent Sakhis.
- ₹49,284 crore capital support provided to SHGs.
- Agriculture & Non-Farm Livelihoods:
- 2.64 crore households established agri-nutri gardens.
- 4.30 crore women farmers supported.
- 3.13 lakh rural enterprises set up through Start-Up Village Entrepreneurship Programme (SVEP).
B. Rural Employment (MGNREGS)
- 99.98% wage payments made via DBT under the National Electronic Fund Management System.
- Now supports asset creation for sustainable livelihoods, converging with Nutri Gardens, fodder farms, and other schemes.
|
Chapter-12. Employment and Skill Development: Key Priorities |
India’s Demographic Advantage
- With 26% of the population aged 10-24 years, India stands at a pivotal moment to leverage its youth for economic growth.
- The nation is set to become the third-largest economy by 2030, following the USA and China.
Employment Trends
- Unemployment rate declined from 6.0% (2017-18) to 3.2% (2023-24).
- Labour Force Participation Rate (LFPR) increased from 49.3% to 50.4%, while Worker-to-Population Ratio (WPR) rose from 46% to 47.2% (Q2 FY24 to Q2 FY25).
- Self-employment share grew from 52.2% (2017-18) to 58.4% (2023-24).
Sectoral Workforce Distribution
- Agriculture’s workforce share increased from 44.1% (2017-18) to 46.1% (2023-24).
- Manufacturing and services sectors saw a decline from 12.1% to 11.4% and 31.1% to 29.7%, respectively.
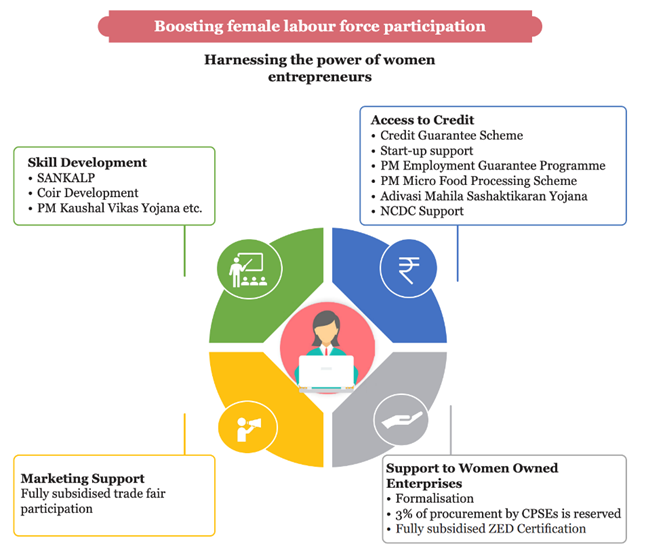
Rising Female Workforce Participation
- Female LFPR surged from 23.3% (2017-18) to 41.7% (2023-24).
- 21 states reported a 30-40% FLFPR, while seven states/UTs exceeded 40%, with Sikkim leading at 56.9%.
Wages and Earnings Growth
- Regular wage/salaried and self-employed workers' earnings increased at a 5% CAGR (2018-19 to 2023-24).
- Casual workers' daily wages grew at 9% CAGR.
- Rural wages:
- Agricultural wage rates increased by 5.7% for men and 7% for women.
- Adjusted for inflation, real wage growth was 0.6% (men) and 1.8% (women).
- Corporate profitability reached a 15-year high, with 22.3% growth in FY24, but employment increased by only 1.5%.
Expanding Formal Sector Employment: EPFO net additions more than doubled, from 61 lakh (FY19) to 131 lakh (FY24).
Unorganised Sector Welfare
- eShram portal facilitates registration and social security benefits for unorganised workers.
- eShram – "One-Stop-Solution" integrates various welfare schemes into a single platform.
Job Creation: Policy & Technological Interventions
- Labour Law Reforms
- Four Labour Codes aim to simplify regulations, ensuring a balance between job security and flexibility:
- Code on Wages, 2019
- Code on Social Security, 2020
- Industrial Relations Code, 2020
- Occupational Safety, Health, and Working Conditions Code, 2020
- Digital Economy & Gig Workforce
- India’s digital economy is projected to exceed USD 1 trillion by 2025.
- The gig workforce is expected to reach 23.5 crore by 2029-30, forming 6.7% of the non-agricultural workforce.
- Green Economy & Employment
- 1.02 million jobs in the renewable energy sector (2023), with hydropower leading.
- Women-led job creation through SHGs and solar entrepreneurship.
- Decentralized Renewable Energy (DRE) to drive climate-smart employment solutions.
- Challenges for women: Climate change, disasters, gender-biased tools, limited financing, and socio-cultural barriers.
Skilling for a Changing Workforce
- Current Skill Levels
- 4.9% of youth (15-29 years) received formal vocational training, while 21.2% were trained informally.
- 90.2% of workers have an education up to secondary level or lower.
- 88.2% of the workforce is engaged in low-skilled jobs.
- Major Skilling Initiatives
- Reskilling & Upskilling:
- 1.24 crore enrolled in Craftsmen Training Scheme (ITIs).
- PMKVY trained 1.57 crore, with 1.21 crore certified.
- Women’s participation in PMKVY: 58% in FY25.
- Future Skills & Industry Collaboration:
- 200+ new-age skills under the National Council for Vocational Education & Training.
- ITI Upgradation Scheme (2024): 1,000 ITIs upgraded in hub-and-spoke model.
- PM Internship Scheme to enhance industry partnerships.
- Digital Skilling Infrastructure:
- Skill India Digital Hub Portal to democratize access to industry-aligned courses.
- Skill India Digital Hub Portal to democratize access to industry-aligned courses.
|
Chapter-13. Labour in the AI Era: Crisis or Catalyst? |
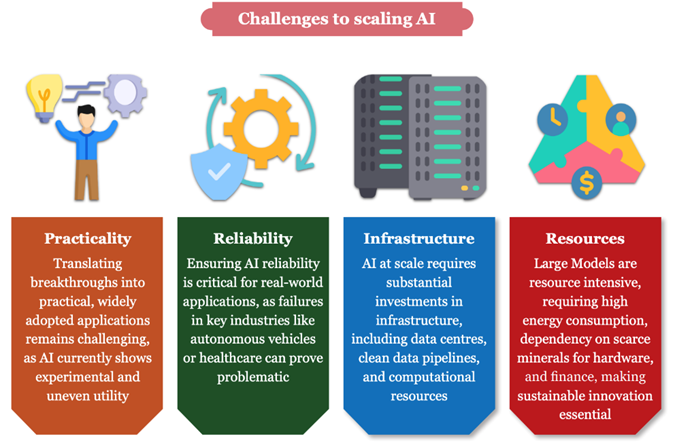
The rapid advancements in Artificial Intelligence (AI) over the past four years are transforming labour markets. While AI-driven automation promises efficiency and innovation, it also raises concerns about economic displacement and widening social inequalities.
AI and Job Disruptions
- Global AI investments (2021-2023): USD 761 billion.
- ILO estimates: 75 million jobs worldwide face complete automation risk.
- NASSCOM projection: India's AI market is set to grow at 25-35% CAGR by 2027.
Human-Centric AI: Balancing Automation & Employment
- AI presents both opportunities and challenges for India's labour-intensive economy.
- Lessons from past tech revolutions show that poorly managed transitions lead to job losses, economic distress, and inequality.
- A collaborative approach between the government, industry, and academia is essential to ensure AI enhances rather than replaces human labour.
- The future of work will be shaped by "Augmented Intelligence", where humans and machines work together rather than compete.
- Strengthening Enabling, Insuring, and Stewarding Institutions will be key to mitigating risks and ensuring an inclusive AI-driven economy.
|
Also Read |
|
| NCERT Books For UPSC | |
| UPSC Monthly Magazine | Best IAS Coaching in Delhi |


